This Month’s Puzzler:
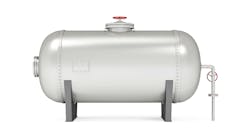
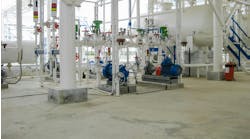
We use N2 at 31 psig to drive 2,200 gallons of a viscous polymer at 235°F through an electrically heat traced and insulated 2-in., sch-10, 347-ft line from a reactor, which, once emptied, is ready for the next batch (see Figure 1). This takes about 210 minutes. Initially, we can put about 25 gpm through the pipe. By the time we’re done, the polymer viscosity has doubled from 380 cP and the flow has dropped to 13.8 gpm. The polymer specific gravity is about 1.05 at 235°F. The reactor is rated for 40 psig. Originally, we used lobe pumps; we switched to the pressurized system because of monomer emissions, contamination of pump barrier fluid, a heel in the reactor, and shearing by the pump. Even with N2, the product continues to crosslink, resulting in the increased viscosity and the slowed-down transfer. Measurements show that the apparent viscosity increases to 1,200 cP for a 3-in. line and 3,600 cP for a 4-in. line. How can we speed up the process? The production manager wants the transfer only to take 30 minutes but believes that boosting the polymer flow rate will substantially increase the N2 demand. What do you think?
Try A Range Of Solutions
Consider the following:
1. Make sure that the heat tracing and insulation are adequate to maintain the temperature of the polymer as it flows in the pipe.
2. Check the integrity of the heat trace system.
3. Inspect insulation to ensure it is not damaged or deteriorated.
4. The figure shows there are at least four sharp-bend ells. If feasible, replace the line and switch the short-bend ells to long-radius ells.
5. If feasible without adversely impacting your process, consider lowering the pressure in the quench tank.
6. The pipeline and refining industries use some chemicals to reduce the viscosity of liquids. Look into using suitable viscosity modifiers, if that does not affect your process adversely.
7. If there is a relationship between temperature and crosslink formation, use that information to select the temperature range where the crosslinking is relatively low. This will help minimize the steep rise in viscosity and, hence, minimize the difficulty in pushing polymer through the pipe.
8. Your data seem to suggest that a smaller diameter pipe will show lower viscosity than that for larger pipes. If this information is reliable, you might consider four 1-in. pipes in parallel.
GC Shah, senior advisor
Wood Group Mustang, Houston
Increase The Pipe Size
First, the production manager is right but only slightly. The polymer flow rate sets the gas flow rate. The gas pressure controls the polymer flow rate because it must overcome the frictional losses in pipe and the static head. The gas required can be calculated by converting gpm to actual cubic feet per minute (acfm):
Qgpm (gpm, polymer)/7.4801 = Qacfm (acfm, N2)
Convert to pounds per hour of nitrogen (pph), W, by multiplying by the density at operating (actual) conditions:
W = Qacfm×60×ρactual
Then, convert to standard cubic feet per minute (scfm) at 60°F, 14.696 psia:
W/ρsc×(1/60) = Qscfm
where ρsc is the density of nitrogen at standard conditions, or
(Qgpm/7.4801)×(ρactual/ρsc) = Qacfm
About 10 scfm of N2 is needed at 31 psig to move 25 gpm of polymer. If we wanted to move 50 gpm, we’d need 37 scfm at 73.5 psig. I estimated 14.54 psia for the barometric pressure based on the 274-ft elevation.
Estimating the apparent viscosity is a challenge because it depends on the shear rate as expressed by pipe diameter. Increasing the shear rate, τ, decreases the apparent viscosity:
τ = [Qgpm/(di/2)3]×4.9
where di is inside diameter, inches. We don’t have a curve for τ versus apparent viscosity, µ, but we do have µ versus pipe diameter, d. A plot of µ versus pipe diameter provides a power law curve, as is expected for a pseudoplastic fluid:
µ = 39.052×(d)3.217
Obviously, replacing the pipeline instead of the reactor is a less expensive option. By going with 3-in. pipe, the starting flow rate, i.e., the maximum flow rate, will increase to about 41.5 gpm. If this viscosity could be maintained, the pumping time would decrease to 53 minutes from 210 minutes at 31 psig. Realistically, with the viscosity rising about 2 cP/minute of transfer time, the viscosity will be 1,296 cP at the end, with a flow rate of only 38.4 gpm then, giving a transfer time of 57 minutes. Thus, perhaps, you could achieve about 55 minutes instead of 210 minutes for a 3-in. pipe. If you went with a 4-in. line at 31 psig, you’d get 40.5 gpm; so, 3-in. is the optimum line size.
Note that the maximum operating pressure for a vessel is assumed at about 80% of the pressure safety valve (PSV) set point: relief valves start to open up at this point. Installing seals on the PSV could permit reaching 90% of the set point but it’s not worth the risk of a sticky PSV staying open. Going up to 90%, i.e., 36 psig for 3-in. pipe, allows a transfer rate of 43 gpm with a time of about 53 minutes. So, while you could boost the flow rate significantly, a 30-minute transfer time is unrealistic.
Dirk Willard, consultant
Wooster, Ohio
February’s Puzzler
We operate a jet mill on superheated 300-psig steam to grind TiO2. The particles from the mill pass through a screen, a cyclone, a baghouse, a filter, and then a blower and silencer. The baghouse uses pulsed compressed air to clean the bags. Recycled solids from the cyclone go by screw conveyor back to the dryer upstream. Unfortunately, the system requires continual attention. The mill’s steam nozzles tend to corrode or erode. The baghouse elements frequently blind. The fins in the blower have bent or broken twice in the past year — no one remembers if this happened in previous years. Sometimes the cyclone bottoms become blocked. Our maintenance manager believes we need an additional cyclone and an oil heater before the first cyclone to keep condensate from forming in its inlet; he’s sure the cold air in the baghouse is condensing steam, causing the sludge we sometimes see in the bottom of the housing. We had been carefully maintaining the heat tracing and insulation but the maintenance budget was cut last year and the fall inspections were eliminated. The operating manager isn’t convinced we need to reinstate them. What do you think our problems are? Is the operating manager right?
Send us your comments, suggestions or solutions for this question by January 16, 2016. We’ll include as many of them as possible in the February 2016 issue and all on ChemicalProcessing.com. Send visuals — a sketch is fine. E-mail us at [email protected] or mail to Process Puzzler, Chemical Processing, 1501 E. Woodfield Rd., Suite 400N, Schaumburg, IL 60173. Fax: (630) 467-1120. Please include your name, title, location and company affiliation in the response.
And, of course, if you have a process problem you’d like to pose to our readers, send it along and we'll be pleased to consider it for publication.

