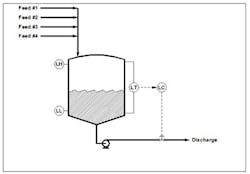
Figure 1. Level controller can’t influence
any feed stream.
The initial article in this series, "Neglect Level Control at Your Peril," examined the behavior of level processes (such as in Figure 1). It specifically looked at the behavior of the reset mode when applied to integrating processes as most industrial level loops are. Especially for large vessels, traditional tuning techniques suggest unreasonably large values for the controller gain, Kc. Applying the Ziegler-Nichols equations to the vessel in Figure 1 gives the following results for the gain and reset time, TI:
Kc = 46 %/%
TI = 1.33 min
The usual action is to reduce Kc. However, for an integrating process, the result is a slowly decaying cycle with a long period. The previous article clearly illustrated this for a noise-free environment.
Here, we'll first examine the behavior in a more typical industrial level loop with noise on the level measurement and frequent changes in flows into or out of the vessel. Then, we'll look at surge vessels -- where Kc intentionally is set to as low a value as possible.
You can use large controller gains such as 46 %/% only in loops with virtually no noise, which essentially restricts them to temperature loops. As illustrated in the previous article, using such a Kc in a noisy level process translates the noise in the level measurement to higher amplitude noise in the signal to the final control element.
Because the amplification of the noise primarily stems from the controller gain, the logical action is to reduce Kc. The main consequences are:
• decreased amplification of the noise; and
• sacrifice of control performance, especially in terms of speed of response.
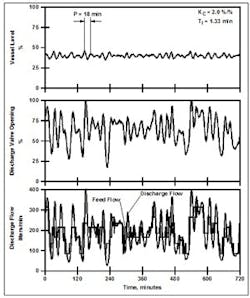
Figure 2 presents the performance for the following tuning: Kc = 2.0 %/% (a modest amplification of the measurement noise); and TI = 1.33 min (the same as suggested by the tuning equations).
The previous article demonstrated this tuning produces a cycle in a noise-free environment. Figure 2 depicts a similar cycle. The variability in feed flow makes the cycle more difficult to quantify. However, especially in the controller output, cycles of a sinusoidal nature are evident in most intervals of the response. The 12-hr period covered in Figure 2 shows at least 26 distinct peaks. This suggests a period (P) of 720/26 = 27.7 min. Arbitrarily selecting two of the peaks gives a period of 18 min. In either case, a reset time of 1.33 min is far too short -- TI should be at least half the period of the cycle.
Visually assessing the nature of cycles in a response is both imprecise and somewhat subjective. Although not routinely applied in the process industries, a more rigorous approach is to apply the Fourier integral to determine the contribution from each frequency to the response. Those loops that exhibit cycles deserve attention. A cycle usually has consequences, so you must understand its origin. Perhaps the cycle stems from the controller or perhaps it originates with a disturbance.
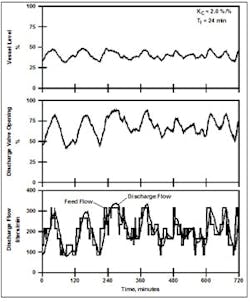
Figure 3 repeats Figure 2 with a TI of 24 min, which hopefully is close to the period of the cycles in Figure 2. Consistent cycles of a sinusoidal nature no longer are evident in the vessel level or controller output. However, this comes at a cost. As the controller is made less aggressive, deviations in vessel level from its set point (SP) increase, as shown in Table 1.
Reducing Kc has a larger adverse effect on performance than increasing TI.
For the process in Figure 1, the level controller moves the variance from the process variable (PV), the vessel level, to the flow through the control valve. This raises two issues:
1. What are the consequences of variations in vessel level? Often the answer is "none." However, there are exceptions -- one being thermosiphon reboilers. The flow through a reboiler is by natural convection, which is affected by the liquid head, which in turn depends on the bottoms level.
2. What are the consequences of variations in the flow through the control valve? If discharge flow in Figure 1 is to a large storage tank, the consequences are nil. However, when the discharge flow is to another process unit, throughput changes usually are major upsets.
LEVEL CONTROL IN SURGE VESSELS
The purpose of a surge vessel is to provide averaging or smoothing so that changes in discharge flow are less rapid and less extreme than changes in feed flow. Tight control of level is counterproductive -- very quickly translating any change in feed flow to a change in discharge flow. Instead, vessel level is allowed to vary "within reason," that is, as long as it doesn't cause process trips on high and low level. The appropriate tuning is the lowest possible Kc that doesn't result in process trips. However, especially in large vessels, reset action in the controller can lead to a discharge flow cycle with a very long period.
If the vessel in Figure 1 is a surge vessel, maintaining as smooth a discharge flow as possible is the primary objective. This suggests low controller gains and long reset times.
In addition, variations in vessel level don't pose consequences, provided no process trips are initiated by the high and low level switches. This suggests two requirements on the controller output:
1. Before the high level switch is actuated, the control valve should be fully open.
2. Before the low level switch is actuated, the control valve should be fully closed (or the flow to the downstream process should be at its minimum acceptable value).
From these requirements, you can compute values for Kc.
In a proportional-integral (PI) controller, the equation for the proportional mode is the following proportional-plus-bias equation:
M = Kc E + MR
where M is controller output, %; E is control error, %, which equals PV – SP for a direct acting controller and SP – PV for a reverse acting controller; and MR is controller output bias, %.
When the reset mode is present, MR is the output of the reset mode. If E is zero (PV = SP), M equals MR. Some, but not all, commercial controllers will display the value of MR. If the controller won't show this value, you can obtain it either by computing via MR = M – Kc E or temporarily setting SP = PV -- because E then is zero, the value of M is MR.
From the proportional-mode equation, you can compute an approximate minimum value for Kc as long as you have the following information:
Value for MR. When reset mode is in use, controller output bias isn't constant. However, when TI is long (as it should be), the value will change very slowly. In the previous responses, the value of MR varies between approximately 60% (for low throughputs) and 80% (for high throughputs).
Value for SP. For all previous responses, the set point for vessel level was 40%.
Location of level switches. In Figure 1 the switches are positioned at vessel levels of approximately 5% and 95%.
Let's require the valve to be fully closed at a level of 10% and fully open at a level of 90%. The level controller is direct acting, so E in the proportional-mode equation is computed as PV – SP. Based on a value of 70% for MR, this translates into the following requirements:
High level trip. At a vessel level of 90% E is 50%. To have a controller output of 100%, Kc = (M – MR)/E = (100% - 70%)/50% = 0.6 %/%.
Low level trip. At a vessel level of 10% E is -30%. To have a controller output of 0%, Kc = (M – MR)/E = (0% - 70%)/(-30%) = 2.33 %/%.
There's one complication to these calculations -- flow through a control valve rarely varies linearly with valve opening. The relationship depends on the nature of the flow system (how much of the pressure drop available for fluid flow is taken by the control valve) and the sizing of the control valve. In a properly sized equal-percentage valve, valve openings less than 50% give very small flows -- not zero, but too small to significantly affect the level. If the requirement is changed to a valve opening of 50% at a vessel level of 10%, Kc = (M – MR)/E = (50% - 70%)/(-30%) = 0.67 %/%.
On the other hand, if the equal-percentage valve is significantly oversized (say by a factor of four), the flow at a valve opening of 50% is nearly the maximum available flow -- once the valve is half open, opening it more has little effect on flow. In such cases, MR would be less than 50% and the above calculations could be performed for M = 10% and M = 50%.
Often flow characteristics are apparent qualitatively but rarely are quantitative data available. The alternative of a nonlinear control equation (as will be described in the next article) usually is the easiest and most reliable approach to assure the valve has been driven to a limit before level reaches either trip point.
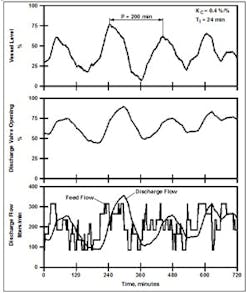
Smaller Kc values than those computed above often prove acceptable. Figure 4 illustrates the performance of the controller for a Kc of 0.4 %/% and a TI of 24 min. Even with this low sensitivity for the controller, discharge flow varies considerably. On one occasion, the discharge flow changes from approximately 350 liters/min to approximately 100 liters/min in about 1 hr. During this same period, vessel level varies from just over 75% to under 10% (but above 5%, so there's no process trip).
The vessel level trend in Figure 4 exhibits a cycle with a period of approximately 200 min. The total duration of the trend is only 12 hr., though, which isn't long enough to be certain a cycle definitely exists. However, let's assume it does. A TI of 24 min is far shorter than half the period of the cycle. Reducing Kc to 2 %/% from 46 %/% mandates a significant increase in TI; so it seems logical that decreasing Kc to 0.4 %/% from 2 %/% also should require an increase in TI.
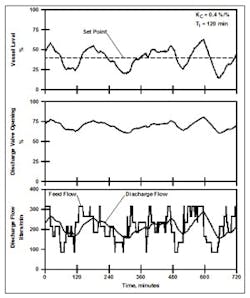
Figure 5 presents the performance for a Kc of 0.4 %/% and a TI of 120 min, which is twice the residence time of the vessel. A cycle still might exist but it's not as evident or as regular as the one in Figure 4. Even so, its period is roughly 3 hr, so a TI of 2 hr exceeds half the period of the cycle.
The performance in Figure 5 generally is preferable to that in Figure 4 (with a TI of 24 min). The variations both in vessel level and discharge valve opening (and consequently discharge flow) clearly are less than in Figure 4. This underscores the need to use long values of TI when Kc is very low.
LONG RESET TIMES
Have you ever seen a controller tuned with a TI of 120 min? If not, there's a very good reason. With conventional controllers, the maximum possible TI usually was around 30 min. With early distributed control systems, the maximum possible TI was comparable (maybe up to 45 min). Even today, some digital control products impose the format of XX.XX on TI, thus limiting the maximum to 99.99 min.
If the required TI exceeds the maximum imposed by the control system, you can either set TI to the maximum allowed by the control system or remove the reset action entirely, which results in proportional-only control. The latter is preferable.
Although advocated by some for level control applications, proportional-only control isn't popular. Most controller implementations permit the reset mode to be "turned off" by entering an appropriate value for the reset tuning coefficient. A value for MR is computed when the loop is switched from manual to automatic. Thereafter, you must make any changes in the value of MR manually. However, manually adjusting MR raises two issues:
Entering a value of MR. Some controller implementations neither display the value of MR nor permit entering a value for MR. Given the rare use of proportional-only control, this isn't surprising. Fortunately, workarounds usually are possible.
Manual reset. In years past, a practice known as "manual reset" basically involved adjusting MR. However, as most loops are PI or proportional-integral-derivative, very few operators now are trained to make adjustments in MR.
While proportional-only control is perfectly acceptable for most level applications, these two obstacles are difficult to overcome.
CECIL L. SMITH is president of Cecil L. Smith, Inc., Baton Rouge, La. E-mail him at [email protected]. This article is based on concepts from his book "Practical Process Control," published by John Wiley & Sons.

