Plant Insights: Bubble-Cap Tray Trade-offs
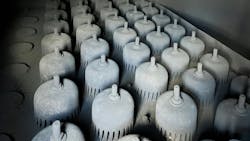
Bubble-cap trays remain in service today even though many people consider them to be old fashioned.
Despite their shortcomings, bubble caps are still an attractive choice for applications in which minimal leakage is allowed and for trays that have large turndown requirements.
Over the years, bubble caps have fallen out of favor due to cost and capacity. The trays have more metal in them, costing more than a tray with valves or perforations, such as a sieve tray. They also provide a lower capacity than most sieve or valve trays. Both of these factors make them less common today. Nevertheless, they may still be in service within older columns, and they do have some specific niches they fill well.
For one, they allow for full seal-welding around every cap. Also, when fully welding the tray to its support ring, leakage rates drop to nearly zero. The tray weld to the support ring may require special expansion joints at the ring or on the tray deck to avoid problems with thermal stress. These welded trays are expensive, but when leaks are intolerable, they are one option.
The second area where bubble caps are is turndown. Even conventional (non-welded) trays will have very low leakage rates when properly installed. Valve trays will always leak at low vapor rates. And the open holes on a sieve tray will certainly leak at low vapor rates. Even at severe turndown, bubble cap trays leak very little.
However, even though the tray won’t leak at low vapor rates, tray efficiency may drop. This is due to localized activity on the tray.
A recent case illustrated this. One of my clients had an older unit running at reduced rates. One tower in the unit had bubble-cap trays running at about 20% of the trays’ useable capacity. Tray efficiency appeared to be low. Calculated efficiency was around 35%. To get the trays to work well enough, defined as 65% efficiency for these conditions, extra condenser and reboiler duty was needed to bring the tray loading up to around 70% of tray capacity. Pressure drops showed no evidence of either vapor or liquid leaking through the trays.
In this instance, the tower was running a low rate, and some of the trays had damage that left them slightly slanted. One side of the tray was higher than the other. Much more liquid was going along the lower side of the tray.
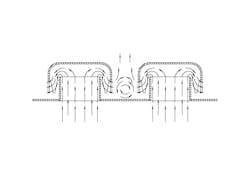
When a bubble-cap tower loads up, the first vapor breaks through the liquid on the tray close to the tray outlet. That’s the location of the lowest pressure drop on the tray. At low rates, the question is: “Where does the second increment of vapor break through the liquid?”
The likely answer is: Right next to the first increment. The pattern continues as the vapor rate increases. The first bit of vapor aerates the liquid at the initial location. This makes the liquid rise. Gravity then causes the liquid to flow away from the aerated area to the still area around it. The lower liquid density just next to the initial location reduces the pressure drop required for vapor to flow through that area. As a result, the second increment of vapor flow tends to occur just next to the first area.
At high enough vapor rates this isn’t important. The entire tray area ends up as bubbling area.
However, at low rates the situation is different. All the vapor may flow through just a few bubble caps. Due to the channeling effect of the initial aeration, these few bubble caps are usually next to each other.
Out-of-level trays can make this much worse. The initial vapor breakthrough occurs on the high part of the tray. The slanted tray makes the channeling affect much stronger. Additionally, a slanted tray ends up with liquid channeling. Much more liquid is flowing through the low part of the tray.
The result for the client was an estimated 68% of the liquid never contacting the rising vapor at all. All the vapor was going up one side of the tower and most of the liquid the other side.
Increasing the condenser and reboiler duties caused more of the tray area to become active and improved the tray efficiency. The increased duties also increased the reflux ratio at the same time. The final product specifications could be achieved when the tower ran at 70% of capacity.
While bubble-cap trays excel in low-leakage and turndown applications, operators should also be aware of additional challenges, such as vapor blowing that can occur at high vapor rates and low liquid rates.
About the Author

Andrew Sloley, Plant InSites columnist
Contributing Editor
ANDREW SLOLEY is a Chemical Processing Contributing Editor.