Cooling Towers: A Critical but Often Neglected Plant Component – Part 1
Cooling towers perform a vital function for chemical process plants, yet they’re often forgotten. While some plants use once-through cooling for some large heat exchangers, most operations rely on open-recirculating systems, which have a cooling tower at the heart.
Plant personnel may overlook tower operation and maintenance as they focus on process chemistry and engineering until a tower or cooling system failure shuts down a unit process.
This article outlines fundamental cooling tower design details and serves as a foundation for Parts two and three of this series, which will discuss water chemistry issues (and their control) that can cause system upsets and failures.
Cooling Tower Overview
With the aid of the next three figures, we will discuss the fundamental layout and operation of the most common types of cooling towers.
The bulk of heat transfer (typically 60% to 90% depending on ambient conditions and other factors) in a tower comes from evaporation of a small portion of the recirculating water.
Cooling towers fully utilize evaporation. They are designed to expose the maximum transient water surface to the maximum flow of air – for the longest period of time. (2)
Accordingly, tower components are designed and selected to maximize heat transfer but within boundaries particular to each application such as makeup and recirculating water quality, plant location and the influence of weather, severity of airborne particulate ingress and other factors.
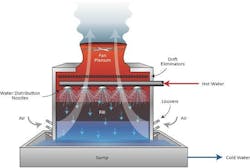
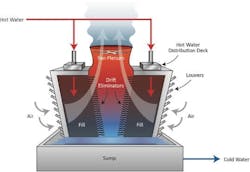
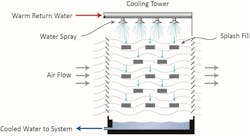
While numerous cooling tower designs, including hybrid variations, have evolved over the decades, the two most common types are counterflow and crossflow mechanical draft towers, shown respectively in Figures 2 and 3.
Counterflow towers are more common than crossflow towers now because of better efficiency and lower pump head, but the crossflow design is still useful, especially in applications where the makeup/recirculating water has a high fouling potential. Most large industrial towers are induced draft, where the fans pull air through the tower rather than pushing it through.
Important Performance Parameters
An essential concept for cooling-tower design is that of "wet bulb" temperature. Consider being outdoors in the shade on a 90°F day at 40% relative humidity at sea level. A standard thermometer would read 90oF, which is the "dry bulb" temperature. The device shown in Figure 4 is an example of an early psychrometer. It has both a plain thermometer and a second thermometer with a piece of cloth covering the bulb that is soaked with water before use.
The psychrometer is on a swivel and can be swirled rapidly through the air. The instrument is appropriately named a “sling psychrometer.” After swirling the device for a short time, the dry-bulb thermometer will still read 90°F, but the wetted thermometer will read 71.2°F.
This latter reading is the wet-bulb temperature and is the lowest theoretical temperature that can be achieved by evaporative cooling. Modern psychrometers are mechanically aspirated (fans move the air across the wetted wick) and are more accurate.
The primary value of an open-recirculating cooling tower is its ability to lower water temperatures well below other methods such as dry-air cooling. However, a cooling tower can never chill the recirculating water to the wet-bulb temperature, and at some point, costs and space requirements limit cooling tower size.
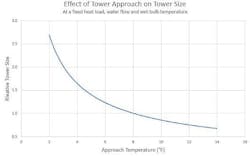
The difference in temperature between the chilled water and wet-bulb value is known as the "approach temperature." Figure 5 outlines the general relationship of tower size to the approach temperature, with economics being a primary factor.
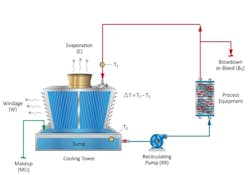
Another important parameter is the range. This is the temperature difference between the warm water entering the tower vs. the cooled water in the basin, which returns to the heat exchangers. It is shown as T1 - T2 in Figure 1. We will return to this issue shortly.
Now, using this information and Figures 1-3 as a continuing reference point, we will outline the importance of the various components within a tower.
Fill
Tower fill is a critical item. Fill increases the surface area of the cascading return water and enhances air/water contact. Early cooling towers had wooden splash fill; a series of slats placed in staggered formation below the water spray or distribution nozzles.
Water impinging on the slats breaks into small droplets that increase the surface area. Splash fill is still used in some towers, particularly if the makeup water has a high fouling potential. Modern splash fills are made of polyvinyl chloride (PVC), high-density polyethylene or polypropylene, with more sophisticated designs than that shown above.
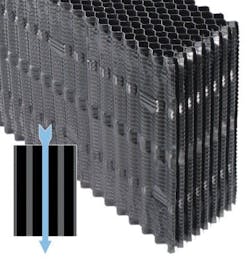
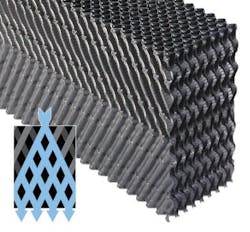
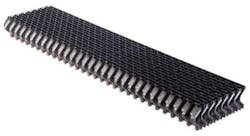
In most towers, film fill is the preferred material. As the name implies, film fill induces water to form a layer on the surface that enhances air-water contact. Typical film fills are made of PVC due to the low cost, durability, good wetting characteristics and inherently low flame spread rate. For higher temperature applications (up to 175°F), film fills made of fire-retardant polypropylene materials are common.
Numerous fill designs are available. Figures 7a and b show two types ranging from the lowest-fouling, lowest-efficiency style to the opposite, high-efficiency (but high-fouling potential) type.
Careful evaluation of makeup and recirculating water characteristics is necessary to select the proper fill type for each application. During outages, plant personnel should inspect fill material for fouling and brittleness. The former task may be difficult, as fouling often occurs in the middle of the fill and may not be visible by simply shining a light through the material from either top or bottom.
Several techniques have been devised to more accurately evaluate fouling, including installation of side ports that allow physical removal of a small section of fill for better visual examination. Another method employs a small section of fill positioned on load cells for continuous monitoring of weight gain.
Fill inspection methods have yielded variable results. It’s best is to embrace the philosophy of “root cause problem elimination (RCPE).” (3) For cooling systems, including tower fill, RCPE includes proper selection and conscientious operation/maintenance of chemical and biocide feed systems. We will examine many of these issues in Parts 2 and 3.
Drift Eliminators
Some water loss from cooling towers is inevitable. Drift is the circulating water that escapes from the tower as droplets entrained in the exhaust air stream. Excessive drift may violate a plant’s air emissions regulations. Modern high-efficiency drift eliminators can reduce this loss to 0.0005% or less of the recirculating water flow rate, which amounts to negligible drift loss.
As with fill, regular drift eliminator inspections are valuable to identify damage or misalignment that could increase drift.
Windage
Water loss due to wind blowing through the tower, termed windage, can result in considerable nuisance in areas adjacent to the tower. Windage can be minimized by inclusion of wind walls (usually installed along the longitudinal centerline of counterflow cooling towers) and external louvers. Louvers are typically either blade-type (corrugated FRP panels are common) or cellular-type similar in appearance to drift eliminators. All crossflow cooling towers will have some type of louvers.
Water Distribution Systems
Counterflow towers have a piped distribution system above the fill to ensure uniform flow.
Regular inspections will reveal plugged, damaged or missing nozzles that reduce tower efficiency and allow channeling of air and water through the fill.
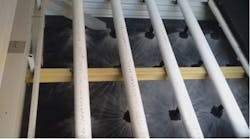
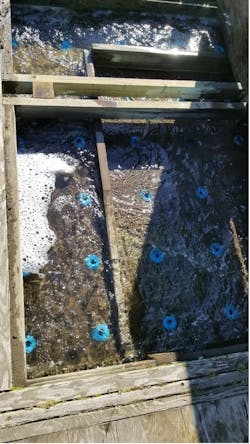
In crossflow towers, the return water is typically discharged onto a distribution deck with uniformly spaced nozzles within the deck that allows the water to feed by gravity onto the fill.
Logic of course suggests the importance of keeping all nozzles clear to maintain uniform flow to the fill. In this case, an added problem may arise from algae that can proliferate in sunlit areas of the tower. Covered decks are common to minimize algae growth.
Fans
As mentioned, most cooling towers have induced draft fans that pull air through the tower.
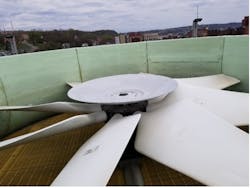
Important aspects of fans beyond size and motor horsepower include speed and blade angle. Stall conditions may arise if the fan pitch is not correctly configured. This condition can exist if the fan blades are pitched higher than manufacturer recommendations for a given set of airflow and static pressure conditions.
Fans may become unbalanced and misaligned from the accumulation of deposits that exit with the exhaust plume, and fan blade leading edges may gradually erode due to constant impact with drift droplets, if drift is excessive. Continuous, online vibration monitoring allows for early detection of problems.
A popular feature is dual-speed fan control or perhaps even variable frequency drive (VFD) control. Thus, rather than placing a cell or cells in or out of service to adjust for load or ambient air-temperature changes, it may be possible to adjust the fan speed. This issue can be quite important for towers located in northern climates to help mitigate air inlet ice accumulation in the winter. The use of VFDs for the fan motor control not only saves energy but per their “soft” start feature, can extend the life of the motor and drive train.
Gearboxes are another item that require regular inspection and lubricant monitoring. Periodic analyses of oil samples for metals content, moisture intrusion and product degradation may offer clues regarding gearbox problems or that it is simply time to replace the lubricant.
Straightforward Water Balance Calculations
Complex mathematics are integral to cooling tower design, and a superb resource for these and many other cooling system details is the Cooling Technology Institute (www.cti.org). For existing towers, straightforward water balance calculations are possible using psychrometric data. An excellent example is outlined in Schaum's Outlines: Thermodynamics for Engineers. (4) However, an even simpler method, as outlined below, is available that provides good approximations:
E = (ƒ * R * ΔT *1.0)/1000 Eq. 1
E = Evaporation in gpm
R = Recirculation rate in gpm
ΔT = Temperature difference (range) between the warm and cooled circulating water (oF)
ƒ = A correction factor that accounts for evaporative heat transfer, where ƒ (average) is often considered to be 0.75 to 1.0 but may range from 0.55 to 1.1 in either very cold or very hot conditions.
Note: This equation is a modified form of the heat-transfer equation Q = m*Cp*DT. (Q referring to the heat gain or loss.) This should not be too surprising since evaporation is strongly dependent on the process heat load. The value of 1.0 in the numerator represents the heat capacity of water at ambient conditions. The equation is often shown without this value when English units are utilized.
A cooling tower’s evaporative capacity is strongly related to the tower’s water to air-mass ratio (commonly referred to as the L/G ratio) and the inlet air relative humidity. A more accurate calculation of evaporation is possible by using one of the several online cooling tower evaporation tools. An example of such a calculator is available at https://spxcooling.com/water-calculator.
To illustrate equation 1, consider a cooling tower at the following conditions (assuming an inlet 78°F wet-bulb temperature, 50% RH and a cold-water temperature of 85°F:
- R = 150,000 gpm
- ΔT = 15oF
- ƒ = 0.95
For these parameters, E = 2,138 gpm. Thus, the required cooling is achieved by just 1.4% evaporation of the recirculating water.
Evaporation in a tower causes an increase in dissolved and suspended solids concentrations. The common vernacular in the industry for the concentration factor is cycles of concentration (COC). COC can be monitored by comparing the levels of a very soluble ion, such as chloride, in the recirculating (R) water and makeup (MU).
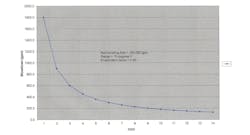
However, this procedure requires laboratory analyses. A typical substitute is online-specific conductivity monitoring of the two streams. The instrument signals can be programmed to automatically bleed off or blow down (BD) some recirculating water when it becomes too concentrated. A common COC range is four to six. The water savings by increasing blowdown beyond this range become minimal, as the graph below (Figure 12) clearly shows.
COC, or perhaps more accurately, allowable COC, varies from tower to tower depending upon many factors including makeup water chemistry, heat load, effectiveness of chemical treatment programs and possible restrictions on water discharge quality or quantity.
Per the evaporation calculation shown in Equation 1, two other mass-balance equations can be derived via basic algebra when COC is known.
BD = E/(COC – 1) Eq. 2
MU = E + BD + D + L Eq. 3
Regarding Equation 3, it has already been noted that some water escapes the tower as drift (D), but in towers with the latest drift eliminators, drift is quite small. Leaks in the cooling system are referred to as losses (L), which also contribute to blowdown. In older systems, leaks from corroded piping and other equipment may be significant. Large leaks represent an unwanted blowdown and can cause significant problems, including excess treatment chemical usage and, if the leak is in an underground line, potential soil erosion. The authors have successfully used portable flow meters with clamp-on sensors to identify leaking cooling water and service water lines.
Conclusion
Cooling towers are critical constituents of thousands of industrial plants and other facilities. This first installment of the series outlined fundamental design and water balance details of the most common towers. Parts 2 and 3 will explore the importance of proper microbiological and chemistry control to ensure cooling tower and cooling system reliability.
References
- Water Essentials Handbook (Tech. Ed.: B. Buecker). ChemTreat, Inc., Glen Allen, VA, 2023. Currently being released in digital format at https://www.chemtreat.com/.
- Cooling Tower Fundamentals (Ed.: J. C. Hensley), 2009. SPX Cooling Technologies, Inc., Overland Park, KS, USA, 2nd Edition.
- https://www.idcon.com/resource-library/root-cause/cost-effective-rcpe/
- Potter, M. C., Somerton, C. W., Schaum's Outlines: Thermodynamics for Engineers, 1993. McGraw-Hill, New York, NY.
- https://spxcooling.com/water-calculator
About the Author
Brad Buecker
President, Buecker & Associates, LLC
Brad Buecker is president of Buecker & Associates LLC consulting and technical writing/marketing. Most recently he served as a senior technical publicist with ChemTreat Inc. He has many years of experience in or supporting the power industry, much of it in steam generation chemistry, water treatment, air quality control and results engineering positions with City Water, Light and Power (Springfield, Illinois) and Kansas City Power and Light Company's (now Evergy) La Cygne, Kansas station. His work has also included 11 years with two engineering firms, Burns and McDonnell and Kiewit, and he spent two years as acting water/wastewater supervisor at a chemical plant.

Richard Aull
President and Principal Engineer
Richard Aull is president and principal engineer of Richard Aull Cooling Tower Consulting, LLC. He has been working in the cooling tower industry for over 40 years, with a specific interest in tower thermal design, performance rating, and analysis. Prior to starting his consulting business in 2017, he held technical positions within Brentwood Industries' cooling tower business unit, first as R&D manager and lastly as director of application engineering. Earlier in his career he held a variety of engineering positions within Research Cottrell's Hamon Cooling Tower Division and the Ecodyne Cooling Tower Services Group. Rich is active in the Cooling Technology Institute (CTI) and has published technical papers and conducted seminars on a variety of cooling tower topics.
