As long as the chemical and refining industries have existed, owners and operators have challenged their plants to generate more revenue by incrementally expanding, or debottlenecking, capacity beyond the nameplate rating. One straightforward expansion approach — duplicating the existing processes and equipment — is easy to understand and generally is low risk but may require substantial capital investment. An alternative approach — rigorously analyzing the existing systems and then leveraging excess equipment capacities identified — requires a deep understanding of process and equipment design but often enables increasing plant capacity at little to no cost. Moreover, the analytical tools can be used to try new ideas. Our experience over the last two decades has shown the immense value of taking the second approach.
So, in this article, we discuss the tools necessary to provide in-depth process knowledge and present a debottlenecking method that takes the guesswork out of incremental expansion planning.
[javascriptSnippet ]
Every process has a certain degree of overdesign, whether applied as a factor to the original heat and material balance, or included by equipment vendors to meet performance guarantees.
Most plant engineers and process experts recognize that simulation can provide a deeper understanding of operations, and thus lead to crucial insights on how to squeeze the most from a plant, whether as additional capacity, improved yields or better energy efficiency. Appreciation of simulation’s value for this is hardly new — a process-modeling-based debottlenecking technique called “stair-step analysis” was introduced in 1999 [1] — but today’s computing power allows simulation sophistication impossible in the past. (However, modeling still suffers from some common errors, see: “Prevent Simulation Meltdowns” http://goo.gl/8vjHJy; many of these can be avoided with a strong validation technique, as discussed below.)
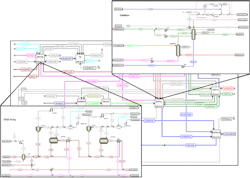
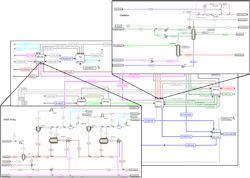
Figure 1. Model covers all parts of the process, with hierarchy blocks (such as the two insets shown) providing additional detail.
The challenge in using simulation to help develop a debottlenecking plan is distilling the complexity of processing into its simplest form — cost and profit. Many of today’s simulation tools not only have improved process and equipment modeling capabilities but also can integrate operating- and capital-cost analyses within the process simulation environment. This article updates the 1999 method by incorporating the newer simulation tools and the lessons learned through years of application.
Method Overview
As a first step, it’s vital to work together with operations, engineering and top management to lay out goals and set the vision. Establish clear expectations at the beginning for timelines and deliverables. The detailed approach we discuss will take more time upfront than simpler ones. At the onset, there won’t be much to show, so instead focus on effectively communicating the foundation being built and the multiple benefits that will come from the project long-term.
Now, let’s summarize the essentials of the method:
1. Assemble the project team and stakeholders.
2. Build the baseline model.
3. Validate the property methods and model results.
4. Solicit stakeholder comment and approval of the validated model.
5. Run the process model at different capacities.
6. Develop performance curves for each system you are evaluating.
7. Rate the existing equipment and system performance.
8. Calculate the maximum capacities of individual equipment.
9. Build the stair-step diagram and identify bottlenecks.
10. Review preliminary results with a multidisciplinary team.
11. Estimate the cost for removing the limiting and near-limiting bottlenecks.
12. Update the stair-step diagram.
13. Explore alternative solutions such as process chemistry changes.
Model Development And Validation
For a stair-step debottlenecking analysis, a model representation of the entire process is vital. This whole-process approach avoids implementing solutions that merely move problems to another area. Figure 1 shows a dry-mill fuel-ethanol plant model flowsheet to give an indication of the level of detail necessary to represent the process.
All parts of the process, from feedstock to salable products, appear in the model. Each “hierarchy block” contains additional process detail that includes all major and some minor equipment. The model also must be able to accurately determine utility consumptions.
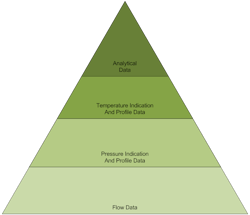
Once the model is assembled, the next critical step is validating it against representative steady-state plant data. Most plants have access to a data historian, where time-stamped data from every instrument visible on the distributed control system can be made available for statistical analysis. Some simulation platforms include very powerful data-reconciliation tools that can assist in validating and reconciling complicated process models like that in Figure 1. Manual reconciliation is possible but in highly integrated processes can be circular and frustrating, consuming significant modeling time. Plant data, because of varying levels of accuracy, will need to be weighted differently during the validation process. Figure 2 depicts a typical weighting hierarchy for most plant operating data.
Analytical data, particularly laboratory measurements, normally carry the greatest precision and accuracy due to the attention given the instruments used. Process temperature readings also are quite accurate due to the simple nature of temperature measurement. To a lesser extent, pressures can be used as validation targets — but pressure measurements often are varied in the validation process to meet temperature targets. Flows, especially plant internal flows, frequently only serve as reference data. Unless the plant regularly calibrates a flow meter, as is done in custody transfer services where high accuracy is required, the flow measurement can tend to drift over time. While Figure 2 represents our typical experience, we recommend conducting a careful, unbiased review of your data accuracy and precision to properly weigh data during validation.
Figure 2. The source of data determines the weighting received, with analytical measurements worth most.
Finally, involving plant operations in the validation review and approval also is very important, not only is it extremely helpful in providing practical knowledge to the modeling engineer but also in instilling some ownership in the final model — a tool that will have many uses beyond the debottlenecking analysis.
Using The Model
The validated model enables determining heat and material balances at progressively higher plant rates. Treat the validated model as the base case and then extrapolate the model to higher rates — a rate roughly 30% more than the current rate generally will suffice to bracket the debottlenecking study. It’s a good idea to generate one or two more cases in-between to establish the linear and nonlinear relationships between equipment performance and plant capacity. The model will produce a large amount of stream and unit operation information like flows, pressures, temperatures and duties that can be captured in a spreadsheet and curve-fitted to determine their relationship to plant capacity.
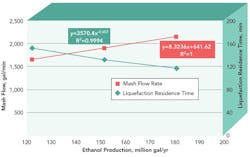
In the example shown in Figure 3, the starch liquefaction reaction can be rated either on reactor feed flow rate (a linear relationship to ethanol production) or reactor residence time (a power-law relationship to ethanol production). Depending upon the size of the plant, the study will have scores of these relationships for all modeled equipment. Table 1 lists a few common relationships of both types.
The type of information extracted from the model will depend upon the method of equipment rating (design flow rate, duty, percent of flood, etc.). The equipment-rating basis will come from several sources:
• design cut sheets (preferred);
• ancillary modeling (e.g., distillation flood calculations, rigorous heat exchanger rating); and
• operator interviews (e.g., temperature, pressure or flow limits).
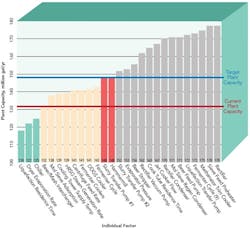
The stair-step debottlenecking method requires capacity ratings for each piece of major equipment. This rating can come either from the equipment vendor (explicitly or implicitly), estimates via suitable equations (e.g., for shell-and-tube heat exchangers) or results of plant trials. First, for the key unit in each major processing step (i.e., distillation column, heat exchanger, boiler, etc.), determine what the overall capacity would be if the entire plant were limited just by that single piece of equipment. Next, organize the equipment by ascending capacity in a stair-step format. The final result, the stair-step chart (Figure 4), clearly depicts the progression of capacity limitations. This approach identifies all the major bottlenecks between the current operation and the desired target, and quantifies the incremental increase in capacity as each bottleneck is removed. It enables directly relating capital investment to eliminate a specific constraint with the added output realized, allowing the plant to base its debottlenecking decisions on the merit of removing each step.
Figure 3. Output varies linearly with mash flow rate and nonlinearly with reactor residence time.
Some modeling platforms can generate capital cost estimates for each incremental step in the progression. A single significant investment to remove a bottleneck may or may not markedly improve plant capacity. Conversely, a negligible investment could result in a sizable boost. Knowing the position and magnitude of these contrasting situations in the progression from current capacity to higher rates is extremely helpful in plant expansion planning. Management may enter the study with a predetermined expansion target but an economic analysis of a progressively expanding plant could help identify an economic “sweet spot,” fostering a sounder business decision.
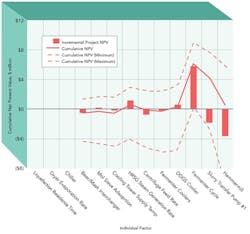
The resulting debottlenecking economic “fingerprint,” which is unique to each plant, generally appears in the form of a simple payback, a cost per unit measure of increased capacity or, as shown in Figure 5, a simple five-year net present value (NPV5) analysis.
The example NPV5 analysis first shows a “prerequisite” investment to remove identified bottlenecks (the liquefaction reactor, the refrigeration chiller and the coproduct dryer) that negatively impact the plant even at current rates. The example also suggests the expansion doesn’t become profitable until investment is made in more fermentation. Depending upon risk tolerance or access to capital, plant management may choose to stop short of the original target. In this example, further investment in slurry transfer and milling doesn’t result in enough capacity increase to cover the capital cost.
Because this is an early-phase evaluation, it focuses on limits related to major equipment capacity. It usually ignores other limits, such as those in plant infrastructure (e.g., electrical switchgear and motor control centers), relief systems, permit thresholds, and offsites (e.g., product tankage, product loadout and transporting facilities).
Figure 4. This type of representation clearly shows which factors most limit capacity.
Next Steps
After completing the capital investment analysis, you may find the expected cost savings are underwhelming. Treat them as a worst case. After all, to keep the original scope reasonable, the study must assume, with minor exceptions, that all process conditions (compositions, temperatures and pressures) are maintained at increased rates, resulting in capital investments to remove each bottleneck. This strict directive results in the most conservative (highest cost) set of solutions.
In the next analysis phase, each bar in the stair-step diagram essentially becomes a mini-project for more-thorough examination of any given bottleneck. During this phase, changing the operating conditions to increase capacity as an alternative to capital investment to remove the bottleneck now is an option. Doing so almost certainly will alter the order and magnitude of the bottlenecks — which is why changing of operating conditions is avoided in the early phase. Once the plant understands the bottleneck progression and worst-case cost as its economic benchmark, the model can and should be used to challenge each bottleneck removal — including, in many cases, exploring no-cost solutions resulting from a process change. As an example, Figure 4 indicates that the beer stripper (operating at sub-atmospheric pressure) will limit the plant at 156 million gal/yr. Worst case, removing this bottleneck will cost approximately $1 million. However, increasing the operating pressure will boost the stripper capacity by reducing the vapor velocity through the column. Although the impact of raising pressure on distillation capacity may be well understood, the effect on the rest of the process may not be as well understood. The model not only will determine the relationship between beer stripper pressure and beer stripper capacity but also will help identify and quantify both the positive and negative impacts on the rest of the process. It’s wise to challenge each step in the bottleneck progression with a few “what-if” scenarios; this will result in a series of new economic fingerprints, each potentially more economical than the previous and almost certainly less expensive than the benchmark case.
Figure 5. Assessing the cost per unit measure of increased capacity provides insights on how much to expand.
Don’t restrict your toolkit of process and equipment models just to debottlenecking. They are valuable for a variety of applications from operations troubleshooting to efficiency improvements. Indeed, the steady-state model used in the debottlenecking study can serve as the environment for countless “what-if” evaluations. Moreover, some modeling platforms include a variety of ancillary tools that build upon the steady-state model. Among these are ones that provide capabilities to evaluate energy-reduction opportunities; design and assess control systems and understand operational transitions; design and rate heat exchangers; evaluate pressure relief scenarios and equipment; analyze pumping systems; design and rate distillation columns; and estimate equipment costs.
Step Smartly
Driven by rigorous process modeling, the stair-step incremental debottlenecking method reduces a large and complex series of technical analyses into an easily understood dollars-and-cents result. In a few short slides, the plant manager can visualize the multidimensional features of a progressing expansion as a cost/benefit continuum. For the plant engineer, the model developed for the debottlenecking analysis becomes a useful tool for other improvement initiatives that will span the life of the plant.
DAVE LITZEN is president of Litzen Process Consulting, Rapid City, S.D. KEITH FLANEGAN is process consultant at ideaCHEM, Rapid City, S.D. E-mail them at [email protected] and [email protected].
LITERATURE CITED
1. Litzen, D. and J. Bravo, “Uncover Low-Cost Debottlenecking Opportunities,” p. 25, Chem. Eng. Progress (March 1999).
