How Much do Chemical Engineers Make? Chemical Processing Reveals all in 2008 Salary Survey
Before you read the 2008 story, why not check out the 2012 Salary Survey results. Click here to see why we say that salaries are moving ahead, slowly.
As presidential candidates have learned, the state of the U.S. economy is taking center stage in this election year. While some observers say the performance may wind up wearing the mask of tragedy, chemical engineers appear to be more inclined to don the mask of happiness over their economic situations based on the results of the 2008 Chemical Processing Salary and Job Satisfaction Survey. For the third consecutive year, salaries, raises, bonuses and job satisfaction have shown improvement over previous years’ survey results.
In the four years we’ve run the annual online survey, the average salaries reported have steadily climbed from $85,234 in 2005 to $95,231 this year (Table 1). Average pay increases were 3% in 2005 and are now 5.06%. The average bonus received has risen from $4,534 in 2005 to $6,561 today. This year’s overall results reflected general contentment. Survey results were collected from a link listed in the print edition of Chemical Processing, on the www.ChemicalProcessing.com, e-newsletters and e-mail blasts sent to readers.
A couple of comments provided by respondents reflect the overall tone of the survey results: “Chemical engineering is a flexible, useful profession with good compensation
and many opportunities to do different things and move into related fields (including management). No job is worth having if you can’t enjoy most of it. There is no good job that you will enjoy every aspect of. That’s why they pay us,” says one.
Table 1. Salary, raise, bonus and age information represent averages of the total respondents in each category.
“Chemical engineering is a great field. It prepares you for many different challenging opportunities. I believe that our biggest challenge in the future is to stop using petroleum for travel so that the remaining barrels can be saved for use in manufacturing chemicals, plastics and pharmaceuticals,” offers another.
Further delving into the survey results reveals the average age of respondents has continued to decline to 45.7 this year, compared to 47 in the first two surveys. The top three annual salary ranges for respondents are between $125,001 to $150,000 (85 or 8.2%), followed by the $100,001 to $105,000 category (77 or 7.4%) and then under
$40,000 (76 or 7.3%) range. For wage increases, 586 (56.6%) of respondents say they received a raise of between 2.5% to 5%. Another 147 (14.3%) say they received a less than 2.5% raise, while 112 (10.9%) got 5.1% to 7.5%. Additionally, 92 (8.9%) of respondents garnered more than 10% while 13 (1.3%) suffered a pay cut. Most people
reported having received a salary increase in less than one year (738 or 71.7%) compared to 2006 respondents when (770 or 63.5%) said the same.
Is your work satisfying?
Table 2. Challenging work has remained the top factor contributing to job satisfaction throughout the four years
the survey has been conducted.
Overall job satisfaction also improved (Figure 1) from previous years. An impressive 90% of respondents called themselves satisfied, with only 10% expressing dissatisfaction. Last year,7.9% of survey participants said they experienced a very high level of job satisfaction compared to 8.3% of this year’s respondents. Another 40.5% of this year’s respondents say their job provides a high level of satisfaction, which is an increase over the 38% reporting a high job satisfaction rate in 2007. This year, 41.2% of respondents say they are somewhat satisfied with their jobs which mirrors last year’s 41.5% who said the same.
Fewer respondents reported a poor level of job satisfaction (8.2%) than those who reported the same in the 2007 survey (10.4%). There were also fewer respondents (2%) who say they have very poor job satisfaction compared to 2.4% in that category last year.
Figure 1. Job satisfaction continues to slightly improve with a few more respondents very satisfied and a few
less unsatisfied.
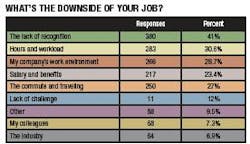
Lack of recognition remains the leading downside most respondents identified about their jobs (Figure 2). This year, 41% of survey participants and in 2007, 41.2% most often identified lack of recognition as what they disliked about their jobs.
The hours and workload was selected by 30.6% of participants as what they dislike most about their jobs. This was closely followed by the company work environment which rankled 28.7% of respondents most.
Split on public perceptions
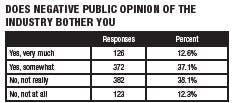
Similar to last year, half of this year’s survey respondents say that negative public perception of the industry bothers them, while the other half say that it doesn’t (Figure 3). The same was true for those who responded to the 2006 survey.
Figure 2. Lack of recognition remains the top reason for job dissatisfaction among survey
respondents.
“The perception of the ‘big bad chemical industry’ goes counter to the fact of the many benefits that the industry has brought to the world,” explains one respondent. “I would like to see Hollywood show what the world was like before safe water, food, and relatively cheap energy, all of which was either brought directly or indirectly to
its current state thanks to the CPI.”
Another survey participant offers this observation: “I have never noticed that negative public opinion of the industry extends to the workers in the industry. The public seems just as likely to think of me as somebody working inside the industry to reduce emissions, improve products, and otherwise counter the perceived ‘negative’ aspects of
the industry. Most people use and appreciate the products of our industry even if they have a sort of general, media-driven disapproval of the chemical industry as a whole.”
People don’t give the industry a fair shake, says one respondent who is troubled by negative public perceptions: “It bothers me that the public thinks that gasoline prices are high because of the oil companies, when the truth is that the oil companies efforts are the reason why gasoline in the U.S.A. is so plentiful and less expensive compared to most countries, especially those that can’t produce as much oil as they consume in products (like the U.S.). The profit margin on a barrel of petroleum products is less than most any other commodity in America. It’s just that the volume demand in the U.S. is so high that even a small margin looks huge when multiplied by the sheer volume. The public doesn’t look at how big the companies have to be and how much capital outlay and expenses they have to incur to realize any earnings in the industry. The public will gladly pay $1 for a quart of bottled water that cost 5 cents to produce, but complain
about paying $3 for a gallon (75 cents for a quart) of gasoline that cost $2.75 to produce.”
How secure is your job?
Figure 3. Negative public opinion of the industry is a split issue with respondents
this year with equal numbers concerned and unconcerned about it.
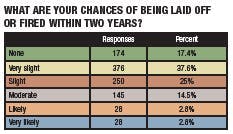
There’s no lack of confidence in chemical engineers job security (Figure 4). Most respondents (51%) believe there is either no chance or a very slight chance that they will be laid off within two years. Another 25% believe the chances of a layoff are slight, with 14.5% saying there’s a moderate chance, 2.8% believing it’s likely and 2.8% who say it’s very likely. However, respondents’ comments show a bit of uneasiness about the future.
Figure 4. Respondents were confident they wouldn’t face job loss.
Advice for the newcomers
Survey participants offered a lot of solid advice for those just entering the workforce. Their useful comments included:
- “Non-engineering aspects of the job, such as supervision, can be more stressful and challenging than any technical challenge you will face. And most likely your education will provide you with no training to deal with these kinds of challenges.”
- “Do not think of yourself more highly than you should. If you assume that older engineers (who don’t use a Blackberry) or operators (who don’t have a college
degree) are not valuable, then you are cutting yourself off from a support system that could help you to soar, or allow you to crash and burn alone. Just because you
were top 10% in a top 10 school does not mean you know more than the high school graduate who has been observing the chemical process system for the last four years, or the older engineer who has already solved that energy balance and knows where the correction factors need to be applied and which instruments are not reliable.” - “Stay current, the field is continually evolving and there is a lot to learn. Visit the F.D.A. website, join the P.D.A. and/or I.S.P.E., read trade publications, talk to
others in the field, etc.”
Winner of iPod
Figure 5. Most respondents aren’t worried about their job security.
A total of 1,078 respondents took part in this year’s survey. Lucinda Deichert,PDM process owner, Baker Petrolite, Sugarland, Texas, was randomly selected as the winner of a 80-GB iPod Classic offered by Chemical Processing for participating this year’s survey. “You’ve got a great magazine that I enjoy very much,” she said after being notified she was this year’s iPod winner. “Thank you for all the information you present monthly, and now for the iPod as well!”
We appreciate the answers and comments we received from all of this year’s survey respondents.


