U.S. Chemical Industry Advances Amid Choppy Seas
Chemical production in the United States continued to expand in 2019 despite protectionist trade policies and a global manufacturing slowdown. Indeed, while many U.S. manufacturing sectors declined last year, the chemical industry remained a positive contributor to growth. American chemical makers, thanks to low-cost energy and feedstocks, maintain a clear competitive advantage in many key product areas. This edge has motivated unprecedented investment in U.S. chemical manufacturing for nearly a decade now. As the new capacity comes online, the American chemical industry is positioned to be a global leader.
Due to softening growth prospects across much of the globe and rising trade tensions, exports have fallen, not only for chemicals themselves but also for chemicals-containing goods. Moreover, U.S. manufacturing is slowing and, in several segments, declining. That said, chemical inventories remained in a relatively balanced position, although elevated historically, at the end of 2019. Housing, an important end-use market for chemicals, should improve slightly as it continues its slow recovery. In addition, despite a pullback from record-high vehicle sales, automotive production is expected to remain at a relatively elevated level. These factors, along with the continued competitive advantage from shale, lay the groundwork for positive growth of the American chemical industry over the next several years.
Last year, performance among individual chemical segments was mixed. Inorganic chemicals, fertilizers and other specialty chemicals showed the strongest output gains. A global manufacturing downturn combined with an uncertain outlook for trade policy will moderate output growth for chemicals in 2020. With 85% of basic and specialty chemicals consumed by the industrial sector, both segments will find this year challenging. It also will be a difficult environment for agricultural chemicals and consumer products.
In 2019, the industry added high-paying American jobs for a seventh consecutive year. Continuing a long-standing tradition of innovation, chemical companies in the United States remain dedicated to providing the essential materials for a growing population and are actively engaged in finding sustainable solutions for the future.
The Macro Economy
In the United States, gross domestic product (GDP) grew 2.3% during 2019, down from a 2.9% gain in 2018. Rising trade tensions have fostered uncertainty and a pullback in business investment, which favorable consumer spending has only partially offset. We anticipate a deceleration to a 1.8% pace in 2020, with below-trend growth also in 2021. Factors such as demographics and debt will mute long-term growth in the economy. U.S. chemical manufacturing will be a positive contributor to the economic outlook as its industrial customers recover and its feedstock advantage remains strong.
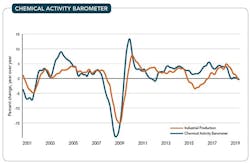
Figure 1. This leading indicator points to near-term gains.
Since the end of the last recession, U.S. economic growth has remained below its potential as high taxes, debt, regulatory burdens and economic policy uncertainty took a toll on both business and consumer confidence. Policy and tax reforms in 2017 and 2018 improved business conditions but rising uncertainty from trade tensions along with a global manufacturing downturn have been leading factors behind the slower U.S. economic growth last year and expected in 2020. Although consumer spending has remained solid, business investment has weakened due to the uncertainty created by protectionist trade policies. This uncertainty has more than offset the positive effects of tax reform and deregulation. Aided by a more-competitive corporate tax system, the need to enhance productivity and competitiveness will foster continued gains in business investment in the long-term but uncertainty over trade policy remains a risk.
The Chemical Activity Barometer (CAB) — a composite index of chemical industry indicators developed by the American Chemistry Council (ACC) that tracks the activity of the broader economy — currently is signaling a slowdown in the U.S. economy into third quarter 2020 (Figure 1).
Outside the United States, performance among major and regional economies has been weak. The imposition of new tariffs and strained trade relations have stalled growth in world trade. Global manufacturing in virtually every market suffered in 2019, with the malaise now spreading to the United States. Europe, in particular, has slowed as have many export-oriented nations in Asia. India will continue to grow at a stronger pace than China, which is suffering from the dispute with the United States, higher food prices, and structural problems. Overleveraging in China remains a concern, as do trade tensions.
The Domestic Outlook
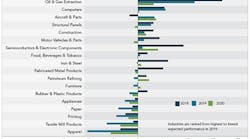
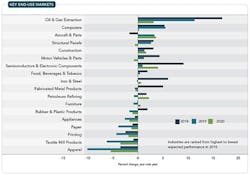
Following strong growth in 2018, industrial output decelerated sharply during 2019 to a 0.9% gain as trade tensions disrupted supply chains and energy investment eased. Slower growth in key trading-partner economies also negatively impacted demand for U.S. exports. In addition, lower growth in business investment (a key driver in 2018), held back by trade-related uncertainties, contributed. Industrial output should decelerate further this year, growing only 0.5%, before strengthening to 1.4% in 2021. Key end-use industries vary in growth expectations for 2020, with the largest gains expected in construction materials, oil and gas extraction, refining, semiconductors and aerospace.
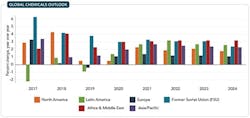
Figure 2. All regions should see at least modest growth.
Housing starts tallied a small gain last year, edging up to 1.26 million, should remain steady into 2020 and show modest progress through 2024 (Figure 2). That said, this is a market that could surprise with stronger performance. Household formations — the leading determinant of housing demand — are growing; job and income gains are improving and will continue to support market demand. Lower mortgage rates in the second half of 2019 also provided some much-needed stimulus. However, shortages of labor and available lots are constraining the pace of growth.
Light vehicles represent an important market for chemicals (over $3,000 per vehicle). Production has eased from the robust pace of 2015–18; U.S. light vehicle sales retreated to 16.9 million in 2019 and should slip to 16.5 million this year (Figure 2). The pent-up demand that fueled vehicle sales in recent years largely has been satisfied and vehicles are better-built and lasting longer. Continued job and income gains won’t take up the slack. Furthermore, credit issues are starting to emerge. The outlook is for sales to ease but remain at elevated levels over the next several years.
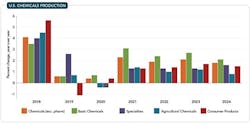
Additional shale-advantaged capacity came online in 2019 from investments made in previous years. However, growth in American industrial output weakened last year, with declines across a diverse set of chemicals-consuming industries. As a result, U.S. chemical production rose by a modest 0.6% during 2019 (Figure 3). The imposition of new tariffs on chemicals and chemicals-containing goods and trade tensions have caused tremendous uncertainty. In addition, inventories remain slightly elevated compared to sales, creating another headwind. Chemical output should grow by 0.4% this year and 2.3% in 2021. Capacity utilization should slip, from 82.9% in 2019 to 81.5% this year, as additional supply comes online in this challenging environment.
Energy dominance still drives U.S. chemical competitiveness. Looking ahead for the next few years, production from new capacity at American sites will continue to come online, although at a slower pace than in recent years. Moreover, despite trade and economic uncertainty, we expect further investment in new capacity through 2024. Exports are key to industry growth over the next decade as rising economies and living standards across the world will fuel demand for chemicals and plastics.
Figure 3. Prospects for chemicals consumption vary widely.
Production of basic chemicals (inorganic chemicals, petrochemicals, plastic resins, synthetic rubber and manufactured fibers) increased by 0.6% in 2019 and growth should edge up by 0.7% this year (Figure 4). As the economy finds firmer footing, we anticipate a gain of 3.1% in 2021. As the pace of capacity expansion slows, basic chemical output growth should ease to below 3% after 2022. Led by gains in shale-advantaged bulk petrochemicals and organics as well as plastic resins, exports will play a large role in expanding production. Major export markets include Latin America, Asia and, to a lesser degree, Europe.
As the largest energy-consuming sector in American manufacturing, the chemical industry continued to benefit from further development of domestic natural gas and natural gas liquids resources, which it uses for fuel and feedstock. According to the U.S. Energy Information Administration, ethane production averaged 1.9 million bbl/d in 2019, more than double the production level a decade ago. Continued gains in production of these resources will underpin positive growth in basic chemicals over the next decade.
Specialty chemicals chalked up 2.6% growth in 2019, following robust gains in 2017 and 2018. However, while the beginning of the year started strong, many specialty chemical markets started to turn down toward the end of 2019. As end-use market demand eases further in 2020 and declines in energy investment continue, we expect specialty chemicals production to slip by 0.4% this year. As the industrial sector recovers in 2021 and beyond, specialty chemicals growth should resume.
Reflecting trade tensions and slower growth abroad, chemical exports fell 2.5% to $137 billion in 2019 while imports of chemical products dropped by 3.9% to $105 billion. As a result, the trade surplus expanded to $32 billion. With the recently announced Phase 1 deal with China and Congressional agreement on the U.S./Mexico/Canada (USMCA) pact, the trade outlook has improved. In 2020, both exports and imports should grow modestly. However, as growth momentum picks up in 2021, U.S. exports of chemicals are set to accelerate. The trade surplus in chemical products should grow to nearly $50 billion by 2024, driven in large part by basic chemicals.
For the seventh straight year, the chemical industry added jobs in 2019. A gain of 11,900 jobs (2.2%) last year reflects new capacity built in recent years. Looking ahead, employment should stay relatively steady through 2024 as productivity gains offset increases in production. Because chemical industry workers are among the highest paid in the manufacturing sector (earning on average $86,000/yr), growing payrolls will strengthen local economies.
Figure 4. Basic chemicals will experience the strongest growth.
Capital Investment
The United States continues to be an attractive investment location. For example, petrochemical producers are significantly expanding American capacity, reversing a decade-long decline in the 2000s. In fact, basic olefins capacity during the 2010s rose by nearly 40%, according to estimates. Indeed, some 340 new chemical production projects, valued at nearly $204 billion altogether, had been announced through late-November 2019; 70% of these are foreign direct investment or include a foreign partner. The dynamics for sustained capital investment are in place and ACC continues to track the wave of new investment from shale gas. However, trade tensions place business investment at risk.
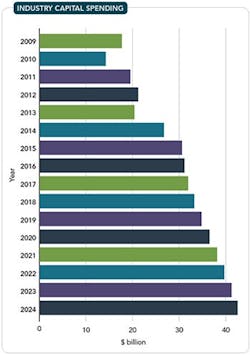
A new capital spending cycle began in 2010 as chemical manufacturers recovered from the recession; significant expansions of existing petrochemical capacity — due to new supplies of natural gas — emerged as the driving motivation. As a result, chemical industry capital spending in the United States surged 133% in the subsequent eight years, reaching $33.2 billion in 2018. During recent years, the chemical industry accounted for nearly one-half of total construction spending by American manufacturers even though it accounts for about 15% of manufacturing value-added. The Tax Cuts and Jobs Act enacted in 2017 helps spur capital spending but trade tensions foster uncertainty and threaten ongoing business investment because many projects target export markets.
U.S. chemical industry capital spending increased by 4.8% in 2019 and should experience a similar gain this year; growth then should ease in 2021 as many projects reach completion. Growth should moderate further in subsequent years but could resume in the period after that should U.S. trade policy prove supportive. (Access to global supply chains and export markets supports a healthy business investment environment.) By 2024, U.S. capital spending by the chemical industry should approach $43 billion — nearly three times the level of spending at the start of this prolonged cycle in 2010 (Figure 5).
Capital spending for bulk petrochemical and organic intermediates as well as for plastic resins should dominate. Spending for process equipment, instrumentation, and structures present strong opportunities during this period.
Global Chemicals Outlook
In the global chemical industry, rising trade tensions and soft world trade along with a global manufacturing downturn created significant headwinds. Overall global chemicals production advanced only 1.0% in 2018, off from the 3.4% pace in 2017. Moreover, the last months of 2019 proved weak. A full recovery only can take place with a resolution of the trade tensions — not just in China but also in Europe and other regions.
Figure 5. Investment in U.S. production facilities will continue to rise.
Resolution of trade tensions and the uncertainty they have created should improve prospects during 2020. We expect global chemicals output to rise by 2.6% this year and 2.7% in 2021. Looking further ahead, we expect gains averaging 2.4% through 2024. In the long term, the developing nations of Asia-Pacific, Africa and the Middle East should be most dynamic. However, growth also should be strong in North America as well and will recover in Latin America. Europe and Japan will lag because of long-term structural and competitiveness challenges.
At the global level, capacity continues to come onstream in many regions of the world. Recent weakness in production, though, has led to easing in capacity utilization since 2017. This may continue over the next several years but capacity utilization likely should remain above 81%. (During the recession, it had fallen to 73%.) With strengthening production volumes, global capacity utilization should improve in the second half of the 2020s.
A Bright Spot
The U.S. chemical industry is set for continued gains despite significant near-term headwinds. With a weaker outlook for the U.S. industrial sector, slow growth in key trading-partner economies, new tariff burdens and unprecedented uncertainty related to U.S. trade policy, the chemical industry is one of few manufacturing segments expected to grow in 2020. This is due to the significant competitive advantage from abundant U.S. energy resources — in particular, surging supplies of natural gas liquids.
The new capacity already started up and slated to come online is state-of-the art and, with abundant feedstock availability, puts the United States in a top competitive position for years to come. Provided that access to export markets remains open to U.S. producers, shale-advantaged chemicals sourced from the United States should find growing markets worldwide as the global economy expands and key end-use markets strengthen. We expect above-trend growth in basic chemicals though 2024 in addition to solid output growth in other segments.
As new production expands to meet growing global demand, the U.S. chemical industry will remain a key employer, providing high-paying jobs and supporting local communities.
KEVIN SWIFT is chief economist and managing director of the American Chemistry Council, Washington, D.C. MARTHA GILCHRIST MOORE is senior director, policy analysis and economics, for the American Chemistry Council, Washington, D.C. Email them at [email protected] and
[email protected].
