Are You Adequately Testing Automated Valves?

The International Society of Automation (ISA) working group responsible for ISA TR 96.05.01 2008 edition on partial stroke testing of automated valves published an update to the original technical report (TR) in late 2017. This latest edition resulted from a lengthy process that included input from end users, valve and actuator original equipment manufacturers, process safety engineers, valve maintenance providers, engineering service companies and consultants. Feedback from end users around the industry has been positive.
Although not containing mandatory requirements, the updated TR is very informative and a must-read for engineers responsible for automated-valve test programs.
The update introduces concepts that were not widely deployed when the 2008 version was issued. These reflect the evolution of more stringent process safety standards and effective proof-testing schemes for critical automated valves, testing and analysis methods. Experience gained from initial partial stroke testing (PST) implementations and automated online valve testing programs revealed key concepts that should be factored into PST and other valve proof-testing programs designed to support process safety objectives.
The most important addition is the concept of margin. Margin is a term familiar to valve and actuator manufacturers as well as valve test engineers; it is a critical performance parameter when assessing any valve’s ability to perform as designed. Simply put, margin is the difference between the force that must be exerted to move the valve closure member to its required position and the capacity of the installed actuator to provide the force needed to make that happen, i.e., capacity – requirement = margin.
The concept of margin is similar to the concept of safety factor that often is specified for new automated valves. However, safety factor is the design objective while margin is the actual result. Theoretically, margin should equal safety factor when the automated valve is brand new. After some time in service, the expected degradation mechanisms, which provided the basis for the target safety factor, will start to affect valve performance and margin will decrease.
An automated valve normally will be considered capable of performing its intended function as long as margin remains equal to or greater than zero. Both actuator capacity and valve operating requirements change due to service conditions and, as a consequence, functional margin degrades. Therefore, PST and other proof-test approaches for demonstrating that automated valves remain capable of performing critical functions on the next cycle or at some point in the future must be capable of assessing the margin condition.
Four Approaches
Operating companies routinely conduct periodic tests to ensure automated valves will perform when needed. The 96.05 working group identified four different measurement, analysis and acceptance criteria approaches now used in the industry during partial stroke testing and designed a process to help end users determine the level of proof-test coverage provided by each.
The four test and evaluations levels are:
Level 1 — partial-stroke test without instrumentation;
Level 2 — partial-stroke test with event timing;
Level 3 — partial- and full-stroke test with actuator-based instrumentation (e.g., control signal, pressure and position feedback); and
Level 4 — partial- and full-stroke test with an external condition monitoring system, including Level 3 parameters and incorporating process system and valve-based measurements (e.g., torque/thrust and acoustic leak detection).
The analyses conducted during development of the 2017 update revealed that proof-test coverage increases significantly with each higher level of implementation. The discussions that led to the current update indicated that Level 1 likely is the most widely used automated-valve testing approach. However, it is the least effective. During a Level 1 test, the valve simply is cycled some partial stroke distance; the only measurement recorded is whether the valve moved. Various papers, technical reports and input from subcommittee participants demonstrate Level 1 implementations provide the lowest level of proof-test coverage.
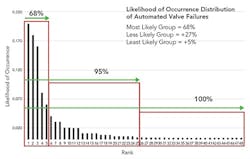
Figure 1. Five categories of causes should account for more than two-thirds of failures.
A Level 2 approach uses instrumentation to measure the time required for the valve to travel between two known positions. With all things kept constant (e.g., system pressure, actuator pressure, solenoid response, etc.), changes in the time required for the valve to travel a known distance and return can serve to detect changes in margin. This additional information increases the test coverage by revealing certain margin-related degradations. It is important to note that the end user must develop meaningful acceptance criteria for changes in cycle time to ensure this approach is as effective as possible.
A Level 3 approach is a built-in feature of certain valve controllers (e.g., position transmitters and positioners). The end user looks for changes in the relationship between control signal, pressure and position supplied by the actuator instrumentation to assess altered performance indicative of margin degradation. A Level 3 approach is straightforward for double-acting actuation but subject to additional uncertainties for single-acting, spring-return actuation. The extra uncertainty stems from the actuator spring providing the closing force and not a measurable pressure.
Level 4 incorporates sensors and data acquisition devices that are installed on the valve and actuator but kept separate from the control system. This often includes torque or thrust gages, pressure transducers, position transmitters and acoustic devices to detect leakage or flow when the valve is closed. A Level 4 approach, although more costly than the others, delivers the highest level of proof-test coverage, lowest probability of failure on demand (PFD) and makes safety targets easier to obtain.
Types Of Failures
The working group also identified 48 different categories of causes of automated-valve failure and force-ranked the list to identify which ones occur most often and which PST implementation level can effectively detect each. Guidance contained in the new TR recommends that end users perform a similar analysis and employ either statistical data or an expert panel process to identify and rank the causes of valve failures at their facilities.
The forced ranking also was used to identify which degradations or causes of failure were most likely, less likely and least likely to occur. The working group developed rudimentary statistical classifications to set the three categories. Five categories of failure, as shown in Figure 1, were estimated to cause failure 68% of the time. The next 20 degradation categories are expected to cause failure 27% of the time with the last 23 degradations only contributing to failure 5% of the time. Consequently, any proof-test approach expected to achieve 95% coverage must detect all causes of failure listed in the most likely and less likely groups.

Table 1. Only Level 4 testing can detect all these causes.
Table 1 provides more details on the five most likely causes of failure. Based on the experience of the working group participants and those surveyed, the most likely cause of automated valve failure actually does not involve the valve or actuator. Instead, failure of solenoids, pilots and other control components lead to more failures than any of the other causes. Issues with control components are expected to cause failure 20% of the time and result in various failure modes including loss of functional margin (LFM), slow to open (STO) and slow to close (STC). Functional margin is affected when less than adequate pressure is available to the actuator for generating the force required to reposition the valve. LFM failures are typically hidden unless detailed measurements are made during the proof-testing process. While automated valves will change position and appear operable during cycle tests under zero- or low-pressure conditions, they may not fully close under more-challenging conditions present when the automated valve must operate during an emergency or upset producing a more-taxing process environment. This deficiency remains hidden when the test approach is not capable of assessing margin.The second most likely degradation simply increases the torque required to reposition the valve. Hydrocarbon byproducts, debris or other contaminants that collect on the valve obturator or seat can cause this. In extreme cases, manufacturing tolerances combined with minor damage or hydrocarbon deposits raise loads beyond the actuator capability and the automated valve appears stuck. However, the most likely effect is higher than originally assumed torque loads. In those cases, the actuator will reposition the valve under zero or low operating pressures but not have the margin needed to reposition the valve under worst case or process upset conditions; this normally remains a hidden failure unless Level 3 or 4 measurements are used to quantify margin changes.
The third most likely cause of automated valve failure is degradation of pressure sealing components within the actuator. When the actuator is new, the internal piston surfaces that react to pressure and create the force needed to reposition the valve can rely on the full pressure assumed in the sizing calculations. When seal degradation or failure reduces the pressure available, the actuator cannot generate the force assumed in the sizing process. Pressure versus position or pressure versus torque measurements available from Level 3 and 4 approaches are needed to identify this normally hidden failure.
The fourth most likely degradation and cause of failure often is a progression of the second culprit. As the debris or buildup on the seat continues to increase, the seat eventually is lifted or deformed in such a way that the valve leaks when closed. This particular degradation requires the valve to be closed and, thus, is not detected by PST. Even when the valve is closed under pressure, leakage can remain hidden unless sensors or test methods capable of identifying and quantifying leakage are used.
The fifth most likely degradation is when the valve will not move and appears stuck. All test levels can identify a failure to open (FTO) or failure to close (FTC).
It is important to note that the four most likely degradations expected to be the cause of failure 62% of the time cannot be detected by the most common Level 1 PST approach.
Automated valves used in safety instrumented systems require periodic proof-testing to ensure the necessary safety integrity level (SIL) is maintained. Two key variables in establishing the SIL for valves used in safety systems are proof-test coverage (sometimes referred to as diagnostic coverage) and probability of failure on demand. Each progressively higher test level discussed above provides an increasing degree of diagnostic coverage that makes SIL objectives easier to obtain — provided the end user employs the data and responds when the data indicate risk of failure is increasing.
How Good Is Your Testing?
It is critically important that end users understand how their selected test strategy identifies and quantifies the degradations known to cause failure of automated valves. The ISA TR 96.05.01 2017 update provides an example of the process end users should employ to determine what level of coverage to expect based on the practices and experience of each facility or operating company.
After lengthy deliberation and analysis, the working group participants concluded that performance measurements are essential during PST execution to make the test meaningful and provide the information on valve operability needed to properly support safety objectives. The working group remains active and plans to continue improving guidance on automated valve testing as new data, experience or know-how emerge. Most recently, the working group has refocused its efforts on in situ proof-testing of automated valves in general. Using the PST guidance as a starting point, the working group is expanding the concepts to applications where PST is not available or the end user has elected to rely on full cycle testing.
STAN HALE is a consultant based in Kennesaw, Ga. LOYD HILLIARD is business manager, severe services, for Puffer-Sweiven, Stafford, Texas. VINCE MEZZANO is a senior fellow, control systems engineering, for Fluor Corp., Sugar Land, Texas, and chair of the ISA S96 Valve Actuators Working Group. Email them at [email protected], [email protected] and [email protected].
About the Author
Stan Hale
consultant
Loyd Hilliard
Loyd is business manager, severe services, for Puffer-Sweiven, Stafford, Texas.
Vince Mezzano
Vince is a senior fellow, control systems engineering, for Fluor Corp., Sugar Land, Texas, and chair of the ISA S96 Valve Actuators Working Group.