Discrete Event Simulation Offers Real Value
As a recent CP article [1] noted, discrete event simulation (DES) can play a significant role in the process industries. At Eli Lilly and Company, we've been using DES to model many of our manufacturing facilities for quite a few years.
Examples of typical applications include:
• capacity analysis and debottlenecking of an analytical laboratory where the simulation showed the main constraint was the number of high-pressure liquid chromatographs, not people as previously thought;
• equipment reliability analysis to help decide if a run-to-fail strategy is better than a planned repair strategy;
• analysis of a device manufacturing line to determine where to locate accumulators to have maximum impact on throughput;
• simulation of the design for a new biotech facility to fully understand capacity and sizing of key systems such as water-for-injection, clean-in-place (CIP) and buffer makeup;
• resource loading analyses to maximize throughput with a given work force;
• capacity analysis of a cartridge inspection facility to predict labor requirements to meet future predicted demand (including projected technology changes as well); and
• prediction of energy requirements for a large system of fermentors, where each fermentor may have different products (with different cooling profiles) and will be on a different loading cycle, to define cooling system requirements.
We've also applied DES in non-manufacturing areas such as research and development, e.g., to simulate patient enrollment in clinical trials [2].
While DES is a key method for simulating systems, other approaches are available -- so it's important to decide if DES is appropriate for a given situation. DES is a good choice when modeling systems that might include:
• multiple pathways in the process, where product can be processed in different ways depending on the type of product or what occurs along the processing route;
• complex resource constraints and allocation decisions that must be represented accurately to understand the process;
• large numbers of primitives (i.e., basic building blocks such as tasks, queues, batching/unbatching and routing) in the model; and
• stochastics overlaid on dynamics (complex queuing systems).
Taking advantage of DES now is far easier than in the past. Today simulation tools are available that are highly capable, cheap, easy to use, flexible and readily connectible to other tools such as statistical packages for data analysis. These tools have significantly broadened the number of people in an organization who can build sophisticated simulations of complex processes as well as reduced the time needed to develop such models. No longer is a degree in industrial engineering or operations research necessary to build DES process models. Now anyone with process knowledge can quickly build useful DE simulations. Further, because mathematical requirements have been significantly reduced, models can more closely resemble the real process with fewer simplifying assumptions.
CAPACITY MODELING
DES has provided valuable insights on how best to run a dedicated-product bulk pharmaceutical plant in a constantly changing production environment. The plant has a complex flow, involving numerous production operations, a wide variety of unit operations (e.g., centrifugation, chromatography, batch reaction and evaporation), product recovery loops and a large number of support operations. DES was a key tool for debottlenecking and modeling potential capacity increase solutions, including some with more complex dynamics and interactions. Examples of capacity modeling performed include:
Chromatography operations. The plant has chromatography steps where cycle times vary within a given column pack and from pack to pack. The models incorporated equations to predict column cycle times as a function of run number. Simulations assessed potential capacity increase options such as raising column resin loading and whether a particular chromatography step needing an additional column also would require another mainstream tank.
Results weren't always as expected.
For instance, column loading analysis showed that raising the column resin loading wouldn't achieve the anticipated capacity increase -- due to charge preparation and charge tank limitations. We identified and simulated potential changes to charge preparation and charging operations to gain additional capacity.
Mainstream tank analysis revealed that the existing tank configuration could achieve target capacities if an additional column were added, and that changing elution logic constraints instead of adding an additional mainstream tank could provide more capacity if needed.
Support systems. Thorough analysis and modeling are necessary to ensure such systems won't limit product operations. DES has proven very useful for assessing shared support systems such as CIP, buffer makeup and high-quality water.
DES also has helped increase the effectiveness of scheduled maintenance by illustrating how planned downtime windows move through the plant.
Now, let's look at two examples of how DES was used for a product supply chain analysis and an equipment sizing and load analysis.
PRODUCT SUPPLY CHAIN
Background: Inventory was being built for potential launch of a new final product. The bulk material has re-evaluation timing -- the product must be re-sampled and tested to verify it's still acceptable for use. The tests can be costly and put a substantial resource load on the analytical lab. With the inventory build, concerns arose that a large quantity of lots could go past their re-evaluation dates. Extending the re-evaluation timing was an option but the impact of the potential extended timing on reducing lot re-evaluation was unknown.
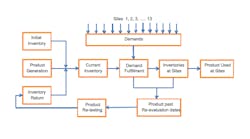
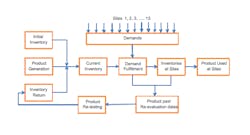
Actions: We constructed a discrete event model to simulate the steps associated with product generation, inventory management and order fulfillment. At a high level, the model feeds items along two paths: those representing demands/product orders travel one path while those representing product flow travel the other. The paths converge, matching specific lots to specific demands based on first-in-first-out along with meeting the particular demand requirements. Product enters the model in two ways -- via initial inventory and a product supply schedule, both of which are read into the model at initiation. Thirteen sites order the product; one requests full product lots while the others want specific increments smaller than a full lot. So, the model must track residual lots. Before orders are filled, a check is made to verify that each lot involved is within dating requirement. Lots that go past dating requirements pass through a retesting loop before being returned to inventory. Checks again are made on dating requirements after hold times at the sites to simulate site inventories. Figure 1 shows a simplified flow schematic of the process.
Inputs to the model included:
• initial product inventory -- lot numbers, dating information and quantities for each specific lot in inventory;
• demand schedule -- monthly orders from each customer;
• product supply schedule -- lot numbers, dates and quantities for product supplied into inventory;
• re-evaluation duration -- number of months from manufacture date until product needs to be re-evaluated; and
• site inventory hold times.
• Outputs from the model included:
• demand filled table -- specifics on which product lots and quantities were used to fill each order;
• lots past re-evaluation dates -- lot numbers, quantities and timing on when lots went past re-evaluation dates; and
• final inventory -- attribute data for lots still in inventory at the end of the simulation.
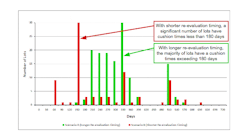
Results/output: We performed multiple simulations, looking at different demand and supply scenarios as well as the impact of potentially extending the re-evaluation duration. Output results, such as number of lots going past re-evaluation dates per year, were captured for each scenario and compared. We then calculated the re-evaluation testing loads and costs for the analytical labs for the different scenarios. Figure 2 shows the impact on "cushion time" (the days remaining from when an order was filled until that lot goes past re-evaluation timing) for two re-evaluation timing scenarios.
SYSTEM LOAD AND DESIGN
Background: A plant was planning to install a new purified water system, including a surge tank and distribution system, to upgrade the quality of water used in one area of the site. The primary option was to supply from an existing purified water tank and distribution system. However, there were concerns about whether the distribution pumps and heat exchangers on that system could handle the increased load. The sizing of the surge tank, distribution and point-of-use loads for the new system along with target supply flow rate into the new surge tank also needed to be specified.
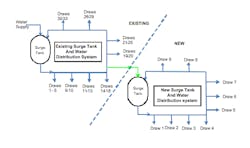
Actions: We constructed a discrete event model of the new purified water system as well as its interaction and supply from the existing system (Figure 3). The model contained the new surge tank, distribution and points of use along with the existing surge tank, supply and distribution. It allowed us to assess the new surge tank and loads while also seeing how the additional supply of water to the new purified water distribution system from the existing system impacted the latter's loads and supply capabilities.
Input parameters to the model included:
• draws for both water systems -- flows, durations and frequencies (using distributions to incorporate variability in frequency);
• water supply flow rates into both surge tanks; and
• surge tanks parameters -- maximum volume, volume that would resume filling tank and volume that would start supplying draws again if the tanks went empty.
Results/output: We performed multiple simulations to evaluate the impact of different surge tank sizes and supply flow rates for the new purified water surge tank and distribution system. The surge tank sizes ranged from 10,000 L to 20,000 L with supply flow rates from 125 L/min to 250 L/min.
The modeling showed that a 15,000-L tank with a 150-L/min water-supply flow rate maintained volume but decreasing the supply flow rate to 125 L/min, even with 20,000-L tank, allowed the surge tank to go empty.
It also revealed that if the new surge tank received 200 L/min the existing surge tank would have trouble maintaining volume -- it would become empty if its supply flow rate was 300 L/min but would easily maintain volume at a supply flow rate of 400 L/min.
DES greatly helped in determining the new surge tank sizing, point-of-use and distribution loads along with target supply flow rate. The modeling clearly showed the interactions and impact of the new system on the existing one, allowed running multiple scenarios very quickly, enabled incorporating stochastics (variability) into the analysis, provided good visual outputs so individuals could easily understand the results, and facilitated a robust design that had good analysis and data supporting the recommendations.
A GROWING ROLE
DES is a very powerful simulation approach that's being used extensively at Eli Lilly and Company to model the flow through real processes. It's helping the company make better decisions about the impact of proposed changes and hence where we can use our resources more effectively. The advent of good tools in recent years has increased the application of DES by enabling more personnel to build these simulations and make them available to the organization. As more successes accumulate, we expect this trend to continue.
BERNARD MCGARVEY, Ph.D., is process modeling group leader for Eli Lilly and Company, Indianapolis, Inc. RICHARD DARGATZ is an associate senior consultant engineer for Eli Lilly in Indianapolis. DAVID DZIRBIK is an associate senior consultant engineer for Eli Lilly in Indianapolis. E-mail them at [email protected], [email protected] and [email protected].
Acknowledgement
The authors would like to thank Roger Scott, Eli Lilly and Company, for his input.
References
1. Cope, D., "Consider Discrete Event Simulation," p. 27, Chemical Processing, Oct. 2010, online at www.ChemicalProcessing.com/articles/2010/178.html.
2. McGarvey, B. M., Dynes, N. J., Lin, B. C., Anderson, W. H., Kremidas, J. P. and Felil, J.C., "A Discrete Event Model Of Clinical Trial Enrollment At Eli Lilly And Company," Proceedings, 2007 Winter Simulation Conference, Washington, D.C.


