Most industrial applications blend liquids for much longer than required — incurring unnecessary burdens on both energy budgets and equipment. Reducing blend time offers an opportunity for increased productivity and decreased costs. Knowing and understanding process requirements is the first step in estimating proper blend time for your application. This article focuses on stirred-tank applications, typically involving center-mounted top-entering mixers. Most low-viscosity turbulent applications require baffles to prevent uncontrolled swirling because solid-body rotation of liquid doesn't create effective mixing. These systems have been studied well enough to provide some actual quantified guidance for predicting process blend times. Other mixers, such as angle-mounted portable mixers, when appropriately positioned quickly blend low-viscosity batches, usually in less than a minute or two [1].
D -- impeller diameter
i, j, k -- exponents
N -- rotational speed
Np -- power number
ni -- number of impellers
P -- impeller power
sp. gr. -- specific gravity
T -- tank diameter
Z -- liquid level
μ -- viscosity
ρ -- density
Θ -- blend time
Testing
Blend time generally is determined by adding a small quantity of liquid to an agitated batch of similar property liquid. Laboratory tests most often add a liquid that results in a color change, from some hue to clear, and conduct tests in transparent tanks — allowing observation of the final color change indicating a degree of complete blending, no matter the location in the tank. Because low-viscosity mixing is a turbulent process the exact location and time will vary from test to test as flow patterns fluctuate. Changing flow patterns and random velocities both are mechanisms by which rapid blending may occur in turbulent conditions. Some more-common color change methods use either a pH indicator solution or an iodine color remover. With the pH approach, a color-to-clear indicator, such as phenolphthalene, first is set to the color form by a dilute caustic solution mixed in the test tank. Then a small quantity of a more-concentrated acid is added on the surface of the liquid. The quantity and concentration of the acid suffice to take the batch from alkaline to acidic condition, making the colored indicator disappear. Repeated tests with careful addition and timing will establish a good average for blend time at the prescribed degree of uniformity. Blend-time test results typically are correlated as a dimensionless blend time (Θ), which is expressed as measured blend time multiplied by the mixer's rotational speed. This group is dimensionless because blend time has the units of time and rotational speed has the units of reciprocal time. The value will be the same for any unit of time, so long as both variables are expressed in that unit. Sometimes Θ is affectionately known as the Betty Crocker number because the time to uniformity effectively is related to the number of impeller revolutions (beater strokes). For turbulent mixing, Θ is a constant. Blend time also depends upon the impeller type and the impeller-to-tank diameter ratio. (We'll address the effects of fluid properties separately.) However, Θ is independent of absolute vessel size. So for geometrically similar mixers and tanks, blending in a small or large tank requires the same number of impeller revolutions. This ability to apply laboratory measurements to process vessels is essential to the practical use of blend time correlations. Scale-up holding blend time constant is impractical as power requirements quickly become excessive.
Determining Blend Time
Degree of uniformity, % |
Relative blend time |
90 |
0.50 |
95 |
0.65 |
99 |
1.0 |
99.9 |
1.5 |
99.99 |
2.0 |
99.999 |
2.5 |
99.9999 |
3.0 |
Correlations have been developed in a form involving Θ, rotational speed (N), impeller-to-tank diameter ratio (D/T), liquid-level-to-tank diameter ratio (Z/T), and number of similar impellers (ni): ΘN(D/T)i(Z/T) -jnik = A (1) If the units for time and length are consistent, A is a constant for an impeller type. Of more practical value is a rearrangement that gives actual blend time for specific types of impellers. For a four-blade 45° pitched-blade turbine, blend time for 99% uniformity can be expressed as: Θ99% = (6.34/N)(D/T)-2.3(Z/T)0.5 ni-0.7 (2) For a four-blade straight-blade turbine, which creates radial flow, the expression becomes: Θ99% = (4.80/N)(D/T)-2.3(Z/T)0.5 ni-0.6 (3) For hydrofoil impellers, typical three-blade, narrow-blade or marine propellers, the expression is: Θ99% = (16.4/N)(D/T)-1.7(Z/T)0.5 ni-0.8 (4) Achieving 99% uniformity may not suffice for some applications. However, because uniformity by blending follows an exponential relationship, it's possible to adjust for other degrees of uniformity (Table 1). While Eqs. 2–4 show that a hydrofoil impeller needs more time for blending (because of its larger constant) than pitched-blade and straight-blade turbines, it offers benefits in power and torque reductions because of its lower turbulent-flow power number (Np): Np = 1.37 for 4-blade 45° pitched-blade turbine;Np = 3.96 for 4-blade straight-blade turbine; andNp = 0.31 for 3-blade hydrofoil impeller.
Example Calculation
Suppose a blending application involves adding a small quantity of an active agent to about 3,000 gal. of a water-like liquid in a 96 in.-dia. tank. Liquid level would be about 96 in. A single 30-in.-dia. pitched-blade turbine turning at 68 rpm (1.13 s-1) provides mixing. Substituting these conditions into Eq. 2 yields an 81-sec. blend time. So in less than one-and-a-half minutes, the 3,000 gal. of liquid can be blended to 99% uniformity.
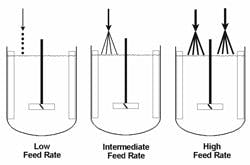
Figure 1: Feed rate -- Rate of addition can significantly
impact the amount of time needed to attain desired uniformity.
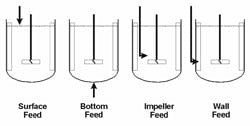
Figure 2: Feed location -- Adding liquid just above the
tip of down-pumping axial-flow impeller generally
provides best results.
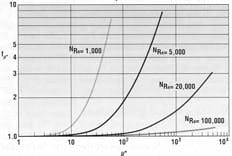
Figure 4. At high NRe even a large difference between feed and bulk viscosities has only slight impact.
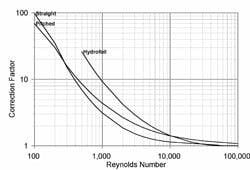
Other effects of density and viscosity occur when one of the blended liquids has a distinctly different property. A significant density difference, especially when blending begins with stratified layers in a tank, may extend blend times by as much as a factor of five to eight. Avoid starting a blend with stratified layers if possible. Blending of different viscosity liquids is a very real and often difficult problem. Some common "kitchen" examples are mixing corn syrup or ketchup in water. Corn syrup is a viscous liquid. Ketchup not only is viscous but also has a yield stress. Figure 4 shows some correction factors for the effects of viscosity ratio on blend time at different bulk NRe. At high NRe even a large viscosity ratio between the feed and bulk has only a minor impact. Effects of different relative quantities of liquids with different properties and effects of nonNewtonian viscosities lengthen required processing times.Enhance PerformanceEstimation of blend time isn't a precise science — blending of individual batches may vary as a function both of turbulence variations and operating procedures. Thus, designing for a calculated blend time of a few minutes is probably inappropriate. However, if an estimated blend time is less than 5 min., then mixing for an hour or even one-half hour may be unnecessary. Some blending applications require other processes to take place, thus justifying longer mixing times. Understanding some major factors influencing blend time, from the inverse relationship with respect to rotational speed of the mixer to the effects of viscosity and viscosity difference, will help improve process results and efficiency. David S. Dickey is senior consultant at MixTech, Inc., Dayton, Ohio. E-mail him at[email protected].Reference:1. Dickey, D. S., and L. B. Fenley, "Make Your Portable Mixer Work for You," Chemical Processing, p. 34, March 2007 (www.ChemicalProcessing.com/articles/2007/040.html).
