Bolster your condition monitoring toolbox
Global competitive pressures have increased demands to keep plants running better, longer and more cost effectively by reducing unscheduled downtime and boosting uptime for machinery assets. Much of the responsibility to optimize asset efficiency falls on maintenance staffs. Yet they face numerous challenges in achieving the goal. For a variety of reasons personnel may not be able to follow precision maintenance practices to the letter; equipment maintenance is becoming more complicated; and environmental and safety laws have grown stricter.
The result has been sustained interest in proactive maintenance programs to help achieve equipment reliability objectives. Condition Monitoring (CM) can play a crucial role in proactive maintenance.
CM involves regularly measuring physical parameters such as vibration, noise, lubricant properties and temperature via non-invasive methods, usually during normal operation of equipment. CM makes it possible to detect machine and component problems before they can result in unexpected downtime and the high costs associated with interruptions in production.
CM ultimately can serve as a platform for implementing a condition-based maintenance program — scheduling maintenance, inspection and overhaul based on machine condition instead of the calendar. The goal is to trend and analyze data to identify troublesome conditions and detect early stages of component degradation. Then, remedial action can be taken to prevent failures and reduce unanticipated downtime.
Many plants already rely on some CM methods, particularly overall vibration monitoring and lubricant analysis. However, the CM toolbox also includes under-appreciated techniques such as time domain analysis and bump testing. So, we’ll look at what various methods involve and the insights they provide.
The sidebar gives some pointers for making the most of these techniques. They (and others) can help promote successful CM programs.
Overall vibration
Vibration can be defined as the behavior of a machine’s mechanical components in response to internal or external forces. Because most rotating-equipment problems cause excessive vibration, this operating parameter generally is considered the best to initially assess a machine’s condition. Vibration monitoring can detect fault conditions such as imbalance, misalignment, rolling bearing degradation, mechanical looseness, structural resonance and soft foundation.
When analyzing vibration, frequency and amplitude of the signal should be evaluated.
The frequency at which the vibration occurs indicates the type of fault (certain types of faults typically occur at certain frequencies). By establishing the frequency, a clearer picture can emerge regarding cause.
Amplitude typically determines the severity of the fault (the higher the amplitude, the higher the vibration and the bigger the problem). Amplitude depends on the size of the machine and must be considered relative to the vibration level of the fully functioning equipment.
A typical starting point is to trend a machine’s overall vibration level. This is the total vibration energy measured within a specific frequency range. In the case of a rotor, for example, the overall vibration would be measured and then compared with its normal value to assess any inconsistencies. A higher-than-normal overall vibration reading would indicate that “something” is affecting the rotor. Further analysis can identify the actual cause.
Figure 1. This small hand-held monitoring tool provides a convenient means to collect data on overall vibration.
Hand-held units such as low-cost vibration pens (Figure 1), overall vibration meters or more sophisticated portable data collectors (Figure 2) and related instruments combining compact size with data storage capabilities make data collection for overall vibration analysis easy. Other options include online surveillance systems to perform round-the-clock monitoring of machinery, regardless of equipment location. This type of technology has been highly engineered to collect data continuously (or at a predetermined data-collection frequency) from permanently installed sensors. Findings then are transmitted to a host computer for subsequent analysis.
FFT spectrum analysis
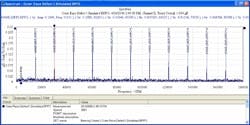
Among methods for viewing vibration and noise signals and pinpointing the causes, a Fast Fourier Transform (FFT) spectrum is perhaps the most useful. Vibration and noise signals are broken down into specific amplitudes at various frequencies. Because each equipment component vibrates at a certain individual rate, maintenance personnel by processing these signals can distinguish between several different rates and then determine which rate coincides with which component. The resulting FFT spectrum can point the way to the location, cause and stage of a problem.
Figure 2. Portable unit stores and analyzes data which also can be uploaded to a computer for more detailed analysis.
User-friendly FFT analyzers have been developed to measure vibration and noise signals and separate them into their component frequencies. These tools can display spectrum information in simplified formats to enable a first-pass diagnosis of machinery condition or identify areas for further scrutiny (Figure 3). The placement of FFT analyzer sensors, setup, and the process of taking measurements can be performed without taking machines out of service.
Time domain analysis
Time domain (or time waveform) signals offer one of the few methods to detect certain types of problems. Time domain analysis also can bolster confidence that data in the frequency spectrum have been properly interpreted; in some instances, it can help confirm a particular problem that simply may have been a “best guess” scenario.
Time domain is the actual data received from machinery and further processed through Fourier Transform to arrive at the frequency domain. This allows personnel to discern actual frequencies and amplitudes of components within a machine and helps target components that may be failing or faulty processes that could have gone undetected until machinery failure.
Figure 3. Particular peaks relate to specific equipment components, enabling pinpointing of causes of vibration and noise.
In general, the time domain is a record of events as they happen and is very similar to looking at recorded sound. A sine wave produced by a signal generator in the lab would appear in the time domain spectrum just as it does on the screen of an oscilloscope. In the real world, though, complications arise because a machine does not produce a solitary signal. That’s where a time domain signal shines.
For example, an operating motor connected to a gearbox and then to a compressor produces thousands or millions of signals that add and subtract to and from each other based upon their relationships and the influence of external forces. All ultimately can be separated and discerned from a time domain signal.
The need for time domain data is absolutely mandatory for some applications. These include cracked, broken or deformed gear teeth in gearboxes; rolling bearing defects on very-low-speed (less than 10 rpm) machines; motor startup transient issues resulting in bearing deterioration and winding problems; and, for reciprocating compressors, short-lived impact-type vibration concerns, such as piston slap, main bearings and inlet or discharge valve problems.
Bump testing
One of the generally under-appreciated CM techniques involves a bump (or rap) test. It can provide operators with a quick indication of whether high levels of vibration or noise are due to the dynamic or static parts of a system. This impact test is carried out to excite the structure to allow measurement of natural frequencies, which then can determine whether high vibration or noise levels are due to resonance or a potential problem with the machinery.
A bump test, unlike most other CM methods, requires that the machine be switched off. An accelerometer is placed on the part of the structure suspected of causing significant resonant frequencies. The most likely sources of these will involve parts (such as fan guards, thin panels and pipe work) that “ring” for a long time after being hit.
The structure is repeatedly but gently hit; during these impacts a measurement from the accelerometer records the responding ring. Its frequency content then is compared with norms.
By identifying a shift in the natural frequency, bump tests can help detect mechanical faults such as cracking in metallic components. (Cracked or poorly bonded structures will exhibit less stiffness, resulting in a change in natural frequency.) The test also can identify weak or unstable structures.
Lubricant analysis
Lubricants represent vital sources of information ready to be unlocked and evaluated as part of a CM program. Results enable operators to confirm use of the proper lubricant, prevent potential over- or under-lubrication, track lubricant use and waste, raise flags about quality (including inorganic contamination, debris from wear or lubricant degradation), and contribute to the desired cleanliness and optimized performance of machines and systems.
Lubricant analysis can satisfy two primary objectives: detecting a problem and diagnosing its source. Many lubricant suppliers often provide basic lubricant analysis as an added-value service for using their lubricants. However, the analysis only may confirm that the lubricant meets specifications and offer little information regarding machinery health. For this reason, one of the first steps in establishing an analysis program for lubricants is to identify the lubricant testing technology employed to make analytical assessments.
While laboratory analysis of lubricants can play an important role in managing machinery assets more effectively, the good news is that not all testing has to be performed in a laboratory. Many of the important characteristics of working lubricants can be examined visually or with the aid of very simple tools.
For example, you can check clarity and water contamination with a standing sample. A magnet drawn up the side of a glass jar containing lubricant diluted with a solvent can detect ferrous materials (filings and metal dust). A bull’s eye sight glass can show flow and discoloration. Simple in-plant tools enable viscosity monitoring. These are good day-to-day observations.
On a broader and more in-depth scale, you should routinely evaluate several critical machine and lubricant parameters including machinery wear particles, contamination, and lubricant or additive degradation.
Truly meaningful lubricant analysis programs encompass testing a wide range of parameters using a variety of methods. Some of the more common test areas are:
- Color and appearance. Regularly check these characteristics. For oils too dark for effective appraisal, reduce the volume of oil to a constant depth for proper observation.
- Viscosity. Oils found to be outside specification always are considered abnormal. However, a change within a grade also can be a sign of trouble. Watch for changes of 10% from new oil.
- Base number. Compare the alkalinity values (base number) of the used diesel engine oil to new oil. As a general rule, change oil when the alkalinity value of the used oil is 50% of the new oil.
- Acid number. Acidity varies in new unused lubricating oils based on the concentration of antiwear (AW), antiscuff (EP) or rust additives. Increases above the new oil reference indicate oil degradation. Lubricants having additives such as zinc dithiophosphate and EP generally exhibit higher acidity than those containing only rust and oxidation additives.
- Emulsion. Water separability testing is primarily used to evaluate steam turbine, hydraulic and circulating oils susceptible to high water contamination.
- Foam. In systems where foam is perceived to be a problem, perform a foam test to confirm whether the lube oil is the source. If the oil isn’t the problem, turn your attention to other influencing parameters (mechanical or operational) to resolve the issue.
Tools aren’t enough
As we’ve discussed, you can draw upon many tools to develop an effective CM program. But don’t overlook or underestimate the human factor. Routine checks and observations by operators and maintenance technicians can yield valuable subjective data. In addition, consider partnering with an experienced specialist; such a firm can add perspective, introduce the latest technology, offer oversight and provide training necessary to maximize results.
Tips and traps
In implementing CM techniques, the first rule of thumb is to be sensitive to in-house levels of experience. Because many maintenance staffs aren’t expert on such methods, here’re some practical pointers.
Vibration monitoring:
- Recognize the vast differences between detecting a machinery problem and analyzing the cause. For example, installing a new bearing to replace one that indicates a high level of vibration may or may not be the solution to bearing failure. Usually, a secondary issue is the primary contributing factor. Such root causes could include misalignment, looseness, imbalance or others; proper analysis will drill down to the right solution.
- Specify sufficient frequency range. The range should be high enough to capture all defect frequencies of interest. For example, sleeve bearing equipment typically is measured to a frequency range of 20 times running speed and rolling element bearing equipment typically is measured to 50 or 60 times running speed.
- Carefully select the measurement point. When collecting machinery vibration data, avoid painted surfaces, unloaded bearing zones, housing splits and structural gaps. These areas cloud response and compromise data integrity. Take measurements at the same precise location for comparison and, when measuring vibration with a hand-held sensor, pay close attention to sensor position, angle and contact pressure.
- Optimize the conditions. Ideally, take measurements while a machine is operating under normal conditions — for example, when the rotor, housing and main bearings are at their regular steady operating temperatures and the machine’s running speed is within the manufacturer’s specifications (rated voltage, flow, pressure and load). For variable-speed equipment, take measurements at the same point in the process or manufacturing cycle. Periodic measurements at all extreme rating conditions can confirm the absence of outlying problems that only appear at extreme conditions.
5. Check equipment status. Make sure the measuring equipment collecting vibration data is in good condition and the transducer has sufficient time to settle after initial power-up.
FFT spectrum analysis:
- Minimize spectral leakage. Applying the FFT method to finite-duration sequences can fall short due to “spectral leakage.” This effect occurs when the signal doesn’t result in a sequence containing the whole number of periods. By applying weighted “windows” to the data sample under review, you can plug such leaks. Caution: while weighted windowing (configured as rectangles, triangles or others) can improve the quality of a spectrum in particular cases, some distortion may still occur.
- Factor in appropriate resolution settings. The FFT frequency spectrum has some basic settings that determine the usability of the data. The FFT is collected with a given resolution that is defined by the frequency span being measured divided by the number of bins or lines collected. Closely spaced defect frequencies may require higher resolution to distinguish. As resolution is raised, the amount of time necessary to collect the data increases.
Time domain analysis:
Establish appropriate measurement intervals. Conventional thinking holds that vibration signals from rotating machinery are stationary and continuous. This implies that the vibration signal is the same from rotation interval to rotation interval, which may not be true. Many impulsive responses will change in amplitude or slide rather than roll over a defect. So, determine a suitable measurement time (typically encompassing 10 to 15 rotations) for the machinery.
Bump testing:
Perform a “background” test. This can show that the vibration present during the bump test is due to the user’s impacting of the structure. In some cases vibration from nearby equipment can transmit through foundations into the equipment being tested. Simply collect data while the machine is off and no impacting is being done on the structure; then compare these to the data collected during operation and impacting.
Lubricant analysis:
- Check the accelerometer. The accelerometer placed onto a machine’s measurement position can skew results unless operators take care. Follow these basic guidelines: the magnet should be firmly screwed onto the accelerometer (any looseness between the magnet and accelerometer will corrupt the reading); the accelerometer should be gently slid onto the measurement position (slamming the transducer onto the machine may cause data overload); the magnet should be in firm contact with the machine’s surface (any movement will be falsely recorded as vibration data); and operators should avoid knocking or disturbing the accelerometer while taking the measurement.
Using any of these techniques, situations may arise where the analysis data can’t clearly identify the cause of a problem. In these cases, outside expertise or a working partnership with a knowledgeable supplier can prove invaluable.
Confirm the lubricant is correct. Critical machinery can benefit from tags placed at grease points identifying the proper lubricant to be analyzed and, if necessary, replaced after analysis.
Scott Brady is director of marketing for SKF Condition Monitoring, San Diego, Calif. E-mail him at [email protected].
- Sample properly. The possible introduction of a contaminant during the sampling process is the most likely cause of invalid analysis results. When taking lubricant samples from storage tanks or equipment in service, workers should adhere to proper sampling techniques.
- Document the results. Detailed documentation makes sharing of test results more widely easier and, in the process, may telegraph useful information for other parts of an operation. Over time, it enables meaningful comparisons based on prior history to help solve current problems.


