Scientific Method: Rethink Experiment Design
The traditional approach to experimentation, often referred to as the scientific method, requires changing only one factor at a time (OFAT). This should not be confused with the full factorial method (Table 1).
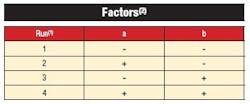
Table 1. An example of a full-factorial test matrix with 2 factors.
1. Average of minimum of two replicates at certain conditions.
2. Factors are variables chosen for degree of influence on response.
The OFAT approach not only suffers from being extremely inefficient, but more importantly, it cannot detect interactions of factors much less map a complex response surface. For example, consider the effects of two factors A and B, such as temperature and pressure, on a response for example, chemical yield. Lets say these factors affect the response as shown by the surface in Figure 1.
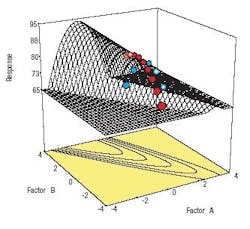
Figure 1. The real contour of the response to factors A and B: interactions are important.
Unfortunately, an experimenter who adheres to the old-fashioned scientific method of OFAT can see things only one dimension at a time. The points on Figure 1 outline the path taken by OFAT done first on factor A from left to right. The results can be seen in Figure 2. They look good.
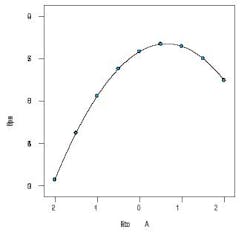
Figure 2. This is how OFAT sees the relationship between the response variable and factor A.
Next the OFAT experimenter sets A at the value where response is maximized and then varies factor B. Figure 3 shows the result. The experiment cries Eureka I have found it! However, it is clear from our perspective in Figure 1 that the outcome falls far short of the potential increase in response.
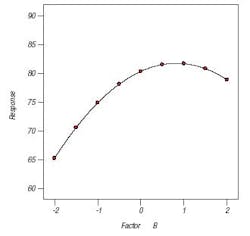
Figure 3. This is how OFAT sees the relationship between the response variable and factor B.
Minimum-run designs
By simply varying factors only at two levels each, but simultaneously rather than one at a time, experimenters can uncover important interactions such as the one depicted in Figure 4.
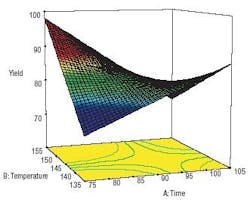
Figure 4. Response surface shows a pure interaction of two factors.
Furthermore, this parallel testing scheme is much more efficient (cost-effective) than the serial approach of OFAT. For up to four factors, the number of runs required to do all combinations, 16 (= 24), may not be prohibitive. These full factorials provide resolution of all effects. However, as a practical matter all you really need to know are the main effects (MEs) and two-factor interactions (2FIs) higher-order effects are so unlikely that they can be assumed to be negligible. Making this assumption (ignoring effects of 3FI or more) opens the door to fractional two-level combinations that suffice for estimating MEs and 2FIs.
Statisticians have spelled these out more than half a century ago. Our previous article on DOE in Chemical Processing [1] details the classical high-resolution fractional design options for up to 11 factors. They can be constructed with the aid of a textbook on DOE [2].
If you dig into traditional options for experiment designs, you will find designs available with as little as k+1 runs, where k equals the number of factors you want to test. One popular class of designs, called Plackett-Burman after the two statisticians who invented them during World War II, offers experiments that come in multiples of four, for example, 11 factors in 12 runs or 19 factors in 20 runs. However, these saturated designs provide very poor resolution main effects will be confused with 2FIs. We advise that you avoid running such low resolution designs. They seemingly offer something for nothing, but the end result may be similar to banging a pipe wrench against a noisy pump the problem goes away only temporarily.
Pulling the pump apart and determining the real cause is a much more effective approach. Similarly, you will be better off running a bigger design that at least resolves main effects clear of any 2FIs. Better yet would be an experimental layout that provides solid estimates of the 2FIs as well. Taking advantage of 21st century computer technology, statisticians developed a very attractive class of designs that require minimum runs, or nearly so (some have an extra one to maintain an equal replication of the lows versus the highs of each factor). [3]. The inventors deemed these designs MR5, where MR stands for minimum run and the number 5 refers to the relatively high resolution sufficient to clearly estimate not only main effects, but also the 2FIs. Table 2 shows the number of runs these MR5s require for 6 to 11 factors far fewer than full factorials or even the standard fractions.
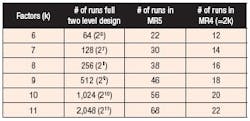
Table 2. New methods require far fewer test than old full-factorial approach.
Designs for up to 50 factors can be readily laid out via commercially available statistical software developed specifically for experimenters [4]. A sample layout for six runs is provided in the Table 3.
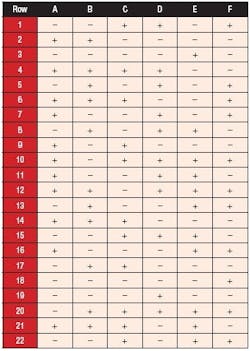
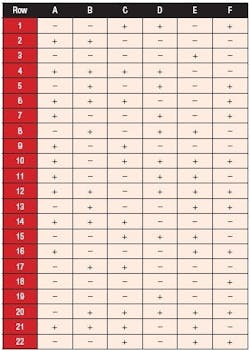
Table 3. The MR5 layout for six factors in case study: + means the factor is increased; - means it is decreased.
It codes the lows as (minus) and highs as + (plus). If you perform this experiment, we recommend that the rows be randomized for your actual run order. If the number of runs far exceed your budget for time and materials, choose the option for MR4 (minimum run resolution four) well enough to screen main effects. As shown in Table 3, these lesser-resolution designs require a number of runs equal to two times the factors, for example: 20 runs for 10 factors (versus 56 for the MR5 and 1,024 for all combinations in the full-factorial).
The power of the approach
Researchers at a client of ours applied DOE to successfully complete pilot studies on a product made via fermentation. Using a predictive model derived from their published results [5], we reproduced it using the new minimum-run design technology. The experiments screened six factors, for which weve simplified the descriptions, thought to affect the yield. For the acid-test, we picked the lower resolution option the MR4 with 12 runs. Table 4 shows the design layout and simulated results.
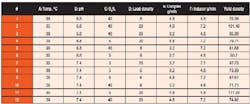
Table 4. MR4 design to screen a fermentation pilot process shows As power to affect yield. (Click to enlarge.)
We will greatly simply the statistical analysis of the data to provide a graphic focus on the bottom-line results. Figure 5 shows an ordered bar chart of the absolute effects scaled by t-values, essentially the number of standard deviations beyond the mean response.
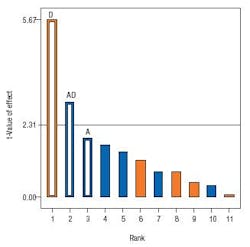
Figure 5. Pareto plot shows the strength of each factor and interactions on yield.
The line at 2.31 t-value represents a significant level for achieving 95% confidence that a given effect did not just occur by chance. In the field of quality, displays like these are known a Pareto plots named after an Italian economist who observed that about 20% of the people owned 80% of a countrys land. Similarly, a rule-of-thumb for DOE says that 20% of the likely effects, main and 2FIs, will emerge as being statistically significant for any given process. In this case, the main effect D towers above the remainder of the 11 effects that can be estimated, other than the overall average, from this 12-run design. However, the effect of factor D apparently depends on the level of A, as evidenced by the bar for interaction AD exceeding the threshold level for significance.
The main effect of A is the next largest bar, which would normally go into what statisticians call the residual pool for estimation of error. However, in this case, the main effect of A goes into the predictive model to support the significant AD interaction. The practical reason why factor A (temperature) should be modeled is illustrated by Figure 6, which shows that its effect depends on the level of factor D the load density.
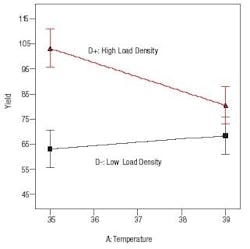
Figure 6. Interaction of factors A and D is strong because lines dont cross.
When D is at the high (+) level, increasing temperature reduces the predicted yield significantly, whereas at low D () the temperature has little effect perhaps somewhat positive on yield. (The key to inferring significance in comparing one end to the other is whether the least significant difference bars overlap or not. Notice that the bars at either end of the upper line on Figure 6 do not overlap, thus their difference are statistically significant.)
This interaction effect proved to be the key for success in the actual fermentation study.
However, for some MR4 cases like this, a sophisticated software that offers forward stepwise regression for modeling such as the one we used, will reveal a truly active interaction such as AD but only if it is isolated and large relative to experimental error. If you suspect beforehand that 2FIs are present in your system, upgrade your design to the higher resolution MR5 or equivalent standard fractional two-level factorial.
Response surface methodology
After a series of screening studies and experiments that reveal two-factor interactions, you may approach a peak of performance that exhibits significant curvature. Then, as we discussed in our previous article, you should augment your two-level factorial into a central composite design (CCD). This is the standard design for response surface methods (RSM), which was invented in 1951. For details on RSM as it is currently practiced, see the reference guidebook [6].
For experiments on six or more factors, the MR5s provide a more efficient core for CCDs than the classical fractions of two-level factorials available half a century ago. For the six-factor case, the standard CCD with a half-fraction for its core requires 52 runs in total. By substituting in the six-factor MR5 laid out in Table 2 as the core, the runs are reduced to 40 a substantial savings with little loss for purposes of RSM. Although someone well-versed on these methods with the MR5 templates in hand would have no trouble laying out CCDs based on these, it becomes far easier with software developed for this purpose [7].
New and improved
By letting go of OFAT in favor of multivariable testing via DOE/RSM, engineers and chemists can become more productive and effective in their experimentation, thus gaining greater knowledge more quickly an imperative for the 21st century. Minimum-run designs, developed in the years since our first article on this subject, make it easier than ever before to optimize larger numbers of factors that affect your chemical process.
References
- Anderson, M.J., Whitcomb, P.J., Design of Experiments Strategies, Project Engineering Annual, pp 46-48, 1998.
- Anderson, M.J., Whitcomb, P.J., DOE Simplified, Productivity, Inc, New York, 2000.
- Oehlert, G.W, Whitcomb, P.J., Small, Efficient, Equireplicated Resolution V Fractions of 2K designs and their Application to Central Composite Designs, Proceedings of 46th Fall Technical Conference. American Society of Quality, Chemical and Process Industries Division and Statistic Division; American Statistical Association, Section on Physical and Engineering Sciences, 2002.
- Helseth, T.J., et al, Design-Ease, Version 7 for Windows, Stat-Ease, Inc, Minneapolis, 2006 ($495), website: www.statease.com.
- Tholudur, A., et al, Using Design of Experiments to Assess Escherichia coli Fermentation Robustness, Bioprocess International, October 2005.
- Anderson, M.J., Whitcomb, P.J., RSM Simplified, Productivity, Inc, New York, 2005.
- Helseth, T.J., et al, Design-Expert, Version 7 for Windows, Stat-Ease, Inc, Minneapolis, 2006 ($995), website: www.statease.com.
Mark J. Anderson and Patrick J. Whitcomb are principals at Stat-Ease in Minneapolis, Minn.; E-mail them at [email protected] and [email protected].