Virtual Fluid Dynamics
Computational fluid dynamics (CFD) is helping to generate million of dollars of savings in chemical process applications. It gives process engineers a more complete understanding of the internal operation of individual unit operations. As a result, some chemical and process companies are equipping their engineers with CFD software and investing in training to improve efficiencies in fluid flow, heat and mass transfer processes.
CFD is a tool for analyzing fluid flow and transport phenomena. Most chemical and process engineers are familiar with Bernoulli's Equation and heat, mass and momentum conservation laws. CFD uses computers to solve the fundamental nonlinear differential equations that describe fluid flow (the Navier-Stokes and allied equations) for predefined geometries with a set of initial boundary conditions, process flow physics and chemistry. The result of CFD is a wealth of predictions for flow velocity, temperature and species concentrations for almost any piece of chemical and process equipment.
CFD is a very potent, nonintrusive, virtual modeling technique with powerful visualization capabilities.
Recent advances in CFD have made it possible to analyze flow problems of ever-increasing complexity, including those involving multiphase flows, mixing-related phenomena, intricate equipment geometries and detailed chemically reacting flows within process-relevant time scales. Frontiers in fluid flow, heat and mass transfer applications are pushed back regularly, and problems that were deemed untouchable just a few years ago now are being solved.
The technical benefits to engineers and the financial benefits to managers are driving the phenomenal rise in CFD use in chemical process applications, and this trend shows no sign of slowing down in the foreseeable future.
The question being asked today no longer is: "What is CFD and how can it be used?" Instead, the relevant question today is: "Why is CFD not being applied to various unit operation flow problems?"
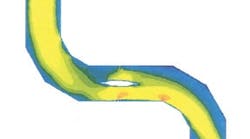
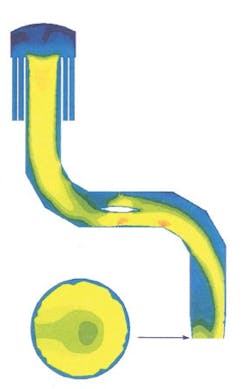
Figure 1. Pipe Flow Modeling Reveals Design Flaw
CFD analysis revealed that airflow was skewed by an unexpected interaction between two bends and the valve wafer in the normal open position. As a result, flow was concentrated on one side when it entered the blower, reducing efficiency.
FCC case cracked with CFD
As a case in point, Mobil Corp., during the past five years, has achieved tens of millions of dollars in capacity and product quality gains by using CFD to improve performance of refinery process units such as reactors, separators and extractors. In one case, Mobil engineers studied flow in the suction line of the main air blower that feeds the regenerator of a fluid catalytic cracking (FCC) unit. The FCC cracking reactions that produce gasoline and heavier liquid fuels also form coke on the fluidized catalyst, which is burned off in the regenerator using air.
The blower in question was designed to draw air at approximately 90 feet per second through a 6-foot (ft)-diameter line and supply it to the regenerator internal air manifold. The calculated blower efficiency was below 90 percent, significantly less than that of similar units and of critical concern because the FCC was blower-limited. Thinking that some nonideal flow feature might exist in the suction line, Mobil analysts used CFD to simulate the entire line, from the ambient air inlet to the blower intake port.
The 2.1 million-cell CFD model included all significant suction line details such as a chambered weather hood, several mitered bends and a butterfly valve with a tapered wafer. A high cell count was required because of the large line diameter and length, coupled with relatively small cells (between 1/4 and 1/2 inch [in.] on a side) needed near the walls to resolve sharp gradients in this area.
The analysis revealed that airflow through the line was strongly skewed by an unexpected interaction between two bends and the valve wafer in its normal open position. (See Fig. 1.) As a result, the flow was concentrated on one side of the line at the point at which it entered the blower ," a feature known to reduce machine efficiency. In effect, only half of the line cross-section and blower inlet was being used.
After gaining an understanding of the problem from the CFD results, Mobil analysts immediately thought of adjusting the equilibrium open position of the valve wafer. The clear advantage of this approach was that it sidestepped much more expensive modifications to the blower inlet and/or less-reliable tactics such as internal turning vanes.
After analyzing air flow through the suction line with the wafer in various positions, the analysts found a configuration that eliminated almost all of the nonideal flow pattern and allowed air flow rates several percentage points higher through the line at the same fixed pressure drop. As a bonus, plant personnel could implement the change simply by re-indexing the wafer relative to the positioning axle. On a blower-limited FCC, such a rate increase has the potential for capacity benefits exceeding $6 million per year.
Slurry reactor enhancements
Denver-based Rentech Inc. achieved a world first by developing three-dimensional (3D) CFD models to simulate bubble-column hydrodynamics in large slurry reactors. The company then would be able to scale up validated models of small-scale reactors easily to commercial-size equipment.
Rentech's approach, based on CFD simulations, is an important step toward designing a full-scale reactor for gas-to-liquid (GTL) conversions using Fischer-Tropsch chemistry. This method has the potential for widespread application in the conversion of refinery residues, an ever-increasing challenge worldwide. Rentech owns, licenses and markets a proprietary and patented process that converts syngas, a mixture of hydrogen and carbon monoxide produced from any carbon containing materials, into valuable liquid hydrocarbons, including diesel fuel, naphthas and waxes.
The Rentech GTL conversion process uses an iron-based catalyst in a slurry reactor. The reactor vessel contains the catalyst suspended in liquid hydrocarbon, and the synthesis gas is brought in at the bottom of the unit and bubbled up through the reactor body. As the bubbles contact the catalyst, the Fischer-Tropsch reaction takes place. Studies suggest petrochemical companies could realize millions of dollars of additional revenues each year in every refinery if the technique were to be commercialized fully and used to convert current refinery residues.
One of the drawbacks in pioneering this technology has been the prohibitively expensive capital equipment costs for plant-scale prototype reactor testing. CFD modeling is a promising alternative for scale-up studies of slurry reactor vessels.
Plant personnel must understand the 3D hydrodynamics in the vessel to achieve a high reaction rate for commercially viable GTL conversion. This high rate inevitably is linked to a high gas-bubble distribution and large gas/liquid interfacial area in the reactor.
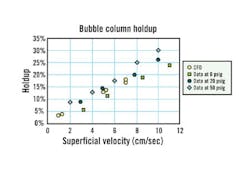
Gas holdup is another important factor affecting reaction rate and must be maximized. Through transient 3D CFD simulations using software, Rentech has been able to determine this parameter for various vessel geometries, bubble release points and bubble diameters. Rentech found a strong correlation between these CFD simulations and results of experimental work, thereby gaining greater confidence in this technique. (See Fig. 2.) With potential savings in the millions of dollars for a single refinery, the technology offers great promise.
Figure 2. CFD Models Bubble Column
Hydrodynamics in Large Slurry Reactors
The modeling performed at Rentech correlated strongly with experimental data, which helped with scale-up of small reactors to commercial-size equipment.
CFD solves spray pattern problem
A packed-bed tubular reactor within BP's chemical stream consists of a tube bundle of several thousand tubes loaded with catalyst particles. The tubes are arranged in an annulus with an outer diameter of 4.8 meters (m) around a central solid core with a diameter of 1.3 m. The headspace at the top of the tube bundle is 1 m high.
Reactant gases enter through an elliptical port located at one side of the headspace. The feed gases are hydrocarbons and air, and most of the hydrocarbons are well mixed with the air upstream of the reactor.
To avoid an explosive mixture in the pipework, a final addition of hydrocarbon ," injected as a liquid spray ," is provided just upstream of the reactor inlet. The intention had been for this spray to evaporate and mix with the feed before it enters the tube bundle.
However, during operation, temperature variations monitored in different tubes indicated different reaction rates. This phenomenon was believed to result from a maldistribution of the hydrocarbons, attributed to poor dispersion of the injected spray and asymmetry in the inlet velocity profile caused by upstream pipework bends.
To quantify this effect, the flow in the upstream pipework and the reactor headspace was modeled using CFD. First, the inlet pipework was modeled with the hydrocarbon spray to establish the reactor inlet velocity and hydrocarbon concentration profiles. Then, using these inlet profiles, the flow in the reactor headspace was modeled, and the distribution of hydrocarbons entering the tube bundle was established. This distribution then could be compared with the temperature distribution in the tubes to determine any correlation between the two.
The final two bends of the inlet pipework (800-millimeter [mm] inner diameter) and the contraction/expansion into the ellipsoidal inlet were modeled using a 3D model with 29,000 grid cells. The flow entering the ducting had a uniform velocity of 27 m/second (m/sec.) and a mass fraction of 0.03 hydrocarbons in air at 155 Degrees C and 1.3 bars. The turbulence model was the k-epsilon RNG (renormalized group theory) to accommodate possible separation at the bends.
The hydrocarbon spray, 2 m from the end of the ducting, was modeled using a dispersed-phase evaporation model, with momentum coupling to the continuous phase. The sprays were delivered via gas-atomized nozzles; previous experimental measurements had shown the mean drop-size to be 80 m.
The modeled sprays, therefore, were input as 45-degree full cones with drop sizes of 53, 80 and 120 m. Evaporation of the drops in the dispersed-phase model is a function of local vapor pressure, temperature and heat and mass transfer between the drops and the continuous phase. From the analysis of velocity magnitude along the inlet ducting, it was evident that the velocity was skewed too high at the top and to one side of the inlet. Some swirl component also is present, but it is small compared to the mean and axial velocities.
The CFD analysis showed that droplet trajectories of 80 microns all evaporate before entering the reactor. The larger drops evaporate to around 50 microns at the reactor inlet; therefore, they can be assumed to evaporate completely soon afterward.
Most of the evaporation occurs near the axis of the pipe, with little time for radial dispersion, which was seen from the concentration profiles of hydrocarbon vapor entering the reactor. Also, the skewed velocity profile resulting from the bends in the ducting concentrates the hydrocarbon to just above the inlet centerline.
The 3D model of the reactor headspace flow used the inlet profiles from the pipework model. The tube bundle was modeled truncated as porous media with enforced vertical flow and a porosity sufficient to ensure a pressure drop similar to the reactor. Velocity vectors in the inlet plane (mid-height in the headspace) show that flow enters with a high inlet velocity and splits around the central section. It then returns around the circumference of the head.
Some asymmetry is found in the slightly higher velocities around one side. The mass fraction of hydrocarbons entering the tube sheet varies from 0.03 immediately in front of the inlet to 0.04 around one side of the central section, with an overall imbalance of hydrocarbons to one side of the reactor.
The locations of the high and low concentrations correlate reasonably with the high and low temperature measurements in the reactor, confirming qualitatively the assumption of uneven dispersion of the injected hydrocarbons within the reactor. This was not only an explanation of the phenomenon, but also a form of validation of the model, which then could be used to design inserts for the reactor headspace to improve mixing of the incoming flow and good distribution across the reactor tubes.
Conclusions
Properly used and validated CFD simulations have demonstrated resultant major financial bottom-line and top-line benefits. They let engineers move beyond simple rules-of-thumb and empirical correlations to in-depth unit operation simulations that provide comprehensive field-flow predictions.
Zdravistch is the chemical and process team customer support team leader and Haidari is industry director for the chemical industry at Fluent Inc., Lebanon, N.H., a developer of CFD software. Contact them at [email protected] and [email protected], respectively.


