Seeq Releases R19 Visual Analytics Software Update
Seeq Corporation releases its first update to the Seeq software application in 2018, staying on plan to provide four new releases each year, according to the company. This is the eighth release of Seeq software in the past 24 months, reportedly driven by input from customers expanding their use of Seeq.
Seeq is a visual analytics offering for engineers and scientists in process manufacturing organizations to rapidly wrangle, investigate and share insights on production data. Target markets include oil and gas, pharmaceutical, chemical, energy, mining, food and beverage and other process industries.
Recent releases of Seeq have focused on enabling larger deployments through scalability features in the software, and by making the Seeq application easier to use. Scalability features in R19 include parallelization of complex calculations across CPUs within a single server, administration tools for performance optimization and increased control and visibility by users into their efforts with real time progress indicators.
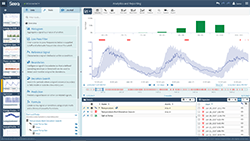
R19 usability features are focused on capsules, the data objects in Seeq for working with single or multi-dimensional time periods of interest. Users can now select capsules to define a custom group of capsules, for example choosing a set of capsules to define an optimized outcome or failure state. And users can leverage capsules when monitoring processes by seeing which capsules are currently “in process” to compare in-progress batches against historical averages of past results in real-time.


