Pipelines at processing facilities impact overall plant performance and profitability. Their efficiency contributes to greater productivity, lower energy costs and better safety. However, ensuring highest pipeline efficiency demands periodic inspections, cleaning and rehabilitation.
Corrosion can decrease efficiency — increasing the energy required to move product, operating temperatures (which may affect chemical reactions) and pressure. Reducing deposit accumulations, friction and corrosion, along with engineering design enhancements, chemical treatments and internal coatings, can accelerate flow rates in pipelines.
Corrosion also can undermine the integrity of pipelines, causing safety risks and leading to expensive replacements.
A line's corrosion rate depends upon what it's handling. Some pipelines, such as those for water, need frequent monitoring and maintenance while others, designed to carry specific chemicals, only require periodic monitoring for impurities that could affect line integrity.
Corrosion significantly contributes to pipeline inefficiencies, especially in water supply and waste lines. Some chemicals also pose substantial corrosion risks. For instance, sulfuric acid at 80–90% concentration isn't corrosive but should its concentration drop to below 50%, say, because of an upset, the acid becomes quite corrosive. Methanol and jet fuel lines that operate intermittently can suffer corrosion and internal metal loss; the fluid itself isn't corrosive but subsequent introduction of water, hydrogen sulfide or other chemicals causes reactions with the steel.
Plant staff should look particularly for corrosion in lines:
• handling feedwater or wastewater;
• in which the concentration of a chemical has gone down, either
inadvertently or because of deliberate dilution;
• where the chemical has become contaminated;
• carrying steel-reactive chemicals; and
• not in constant use.
Typical indicators of corrosion include:
• greater turbulence (friction factor);
• higher pump energy consumption;
• increased pressure drop;
• decreased flow rate; and
• elevated product temperature.
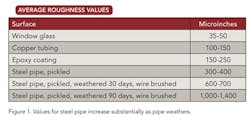
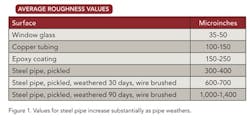
The surface condition of the inside wall of a pipe also impacts flow efficiency. In a commercially manufactured pipe this wall isn't smooth (Figure 1). The degree of surface roughness is a function of the pipe material, method of descaling and environment to which it has been exposed. In turbulent flow the surface roughness affects the friction factor and, thus, the pressure gradient in the pipe.
Over time, scale and deposits may form, impeding flow — reducing throughput, stressing equipment and increasing the probability of unscheduled downtime.
For a simple, short, straight section of a 12-in.-diameter (9,300-mm) water line, "The Pipeline Pigging Handbook," 3rd edition, notes: "if the inside diameter is reduced by 5% (15 mm) by a smooth deposit, the loss of throughput at a given pressure would be over 10%. To bring the throughput back to its original level would require pressure to be increased by almost 30%. However, if as is more likely, the deposit was uneven, the resulting turbulent flow may cause an effective reduction of 15%. In this case, throughput could be reduced by some 35%, while the pressure to overcome these losses would need to be increased by more than 140%."
PROBLEM DETECTION
Routine inline inspections provide a good sense of the condition and projected life of the line. They can identify potential problems, including safety or fluid-contamination issues, and may give early enough warning so managers can plan repairs during a scheduled turnaround.
Technologies to assess line condition and evaluate welds include visual, X-ray, magnetic flux leakage (MFL) and ultrasonics. The most common are caliper or geometric inspection, MFL and ultrasonic.
Caliper or geometric tools effectively detect and size deformations that can affect pipeline integrity or impede the passage of other inspection (or cleaning) tools.
MFL and ultrasonic "smart pigs" can detect anomalies and metal loss over the 360° circumference of the pipeline wall, differentiate between internal and external location, and produce longitudinal distance measurements that accurately pinpoint anomalies. They come with analysis software that provides hard copy reports with pipeline defect definition data as well as joint-count and anomaly tables. These detailed reports highlight out-of-specification findings based on 360° scans at a rate of up to 8,000 samples/second with resolution of ¼ inch. The reports include A, B and C scan data, as well as 3-D color-coded representations of wall thickness.
In selecting inspection technology, a plant should consider factors such as cost, pipeline bend radius, length of tools, fluid medium, pressure ratings of the pipeline and wall thickness. MFL tools are less expensive than ultrasonic ones but typically are longer (up to 8-ft long for an 8-in. line) and may require higher pressures and flow rates. Ultrasonic tools generally are smaller than MFL ones and can be bi-directional but are more expensive and must be run in water or another suitable fluid.
Effective inspections examine both the inside and outside of the pipe wall, identify corrosion, and record denting, pitting, ovality and swelling.
Inspections also provide a baseline for future evaluations and to develop more precise estimates of corrosion rate and pipeline life expectancy. Some companies with regular pipeline maintenance programs install permanent pigging launching and receiving facilities to make it easier, less costly and more efficient to conduct frequent inspections.
MAINTENANCE PROGRAM
Outside of capital investments, effective pipeline maintenance is the only way to significantly impact performance. Even incremental improvements may deliver substantial returns.
An operating company should establish a pipeline maintenance program for every site. This involves first evaluating each pipeline to gauge current throughput efficiency, performing thorough pipeline maintenance, and then rechecking efficiency to evaluate the overall upgrade. Regular pipeline flow studies over time can track declines in product flow efficiency — and prompt pigging, flow sweeping, corrosion inhibition and other maintenance activities when the efficiency drop becomes significant.
Pipeline flow efficiency test. It's relatively easy to estimate what the expected pressure drop of a particular pipeline should be by analyzing original design drawings and calculations. The difference between original design and actual pressure drop indicates lost efficiency due to buildup of scale, sediment or corrosion on the pipe wall, and enables estimating potential energy savings and throughput increases to justify the cost of a cleaning program.
Recently, a refinery estimated solids' buildup in a 22-in. raw water line was causing an additional pressure drop of 7.5 psi. It reckoned cleaning the line would increase flow to 3,400 gpm from 2,800 gpm; this would allow for single pump operation most of the year, saving $100,000/year.
A variety of details are helpful for assessing the potential improvement: the piping's manufacturer, age, outer and inner diameters, wall thickness, and whether it's piggable and there's a history of corrosion or leaks; the fluid's composition, specific gravity, temperature, pressure, flow rate and velocity; the upstream and downstream pumps' suction and discharge pressures; and the type of efficiency problem (low flow, solids, sludge, scale, etc.) if known.
Analyses for liquid pipelines include flow rate, pressure drop, velocity, pumping power and reduction in diameter. Frictional pressure drop (ΔP) is the pressure difference between the beginning measurement point (P1) and the ending measurement point (P2) over a given length (L) of pipe. Pressure drops should take into account equivalent lengths, elbows, valves, fittings and elevation changes.
At Clean Harbors, we use the following rules of thumb and equation: maximum liquid velocity shouldn't exceed 15 ft/sec (4.6 m/sec); minimum velocity shouldn't drop below 3 ft/sec (0.9 m/sec); and flow is determined via:
ΔP = (11.5×10 -6) fLQ2SG/d5
where ΔP is in psi; f is the Moody friction factor, dimensionless; L is in ft; Q is liquid flow rate, bbl/day; SG is the specific gravity of the liquid relative to water; and d is pipe inner diameter, inches.
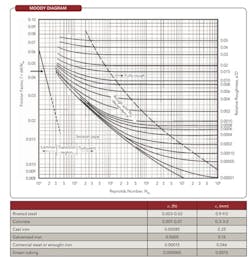
The Moody diagram (Figure 2) plots ƒ as a function of Reynolds number, NRe, and relative roughness, i.e., absolute roughness, ε, divided by pipe diameter, D. At NRe less than 2,100, laminar flow prevails and f only is a function of NRe while at NRe exceeding 2,100 (flow in the transition and turbulent regimes) relative roughness also has an impact on f, so it's necessary to determine ε. Deterioration over time due to corrosion, erosion and scale buildup considerably increases the roughness factor, thereby reducing the pipe's effective diameter and requiring an adjustment in f.
OPTIMAL PERFORMANCE
A plant can take several steps to maintain flow efficiency:
Cleaning. A number of technologies can increase efficiency and safety, and extend pipeline life. These range from closed-loop pigging to onstream mechanical, chemical or ultrasonic cleaning.
Selecting the most effective cleaning strategy requires some knowledge of the scale or residue that may be in the line. Examining a sample of the deposits will allow for a better determination of the types of pigs needed, and chemical cleaning agent(s), e.g., detergents, surfactants or acids, best suited for the pipeline. This also will aid in the planning for collection and disposal of effluents from cleaning. In some cases, chemical circulation or vapor phase cleaning may be the most effective cleaning option.
Internal pipeline rehabilitation and coating. Following inspection and cleaning, coating the inner pipeline surface often provides the most effective approach to increasing pipeline efficiency and durability. This effectively isolates the metal surface from water, hydrogen sulfide and other contaminants. An epoxy coating eliminates corrosion because there's no contact between the pipe wall and the material being transported. The coating increases throughput and reduces maintenance and inhibitor costs at a fraction of the cost of pipeline replacement. It can rehabilitate long sections of existing pipelines and extend the life of new ones.
The in-situ epoxy coating process only requires access at the ends of the pipeline segment being serviced. The particular epoxy coating chosen depends upon the material being transported. Two specially designed coating pigs, operated at a closely controlled driving pressure and velocity, apply a series of thin coats of the specified epoxy over several passes. The process provides a uniform, smooth, homogeneous coating throughout the pipeline, including all field joints (welds) and bends. The coating's surface roughness doesn't increase over time, unlike that of an uncoated surface.
Measuring the improvement. The increase in pipeline flow efficiency should be evident, and can be as much as 15–30% after cleaning and especially after internal coating. The percentage improvement as it relates to fluid throughput can be determined via:
% = (ΔPafter cleaning - ΔPbefore cleaning) × 100
(Note that ΔP is proportional to the square of flow rate.)
THE BOTTOM LINE
With fixed throughput and upstream pressure, a well-maintained pipeline section can achieve a higher downstream pressure by decreasing the surface roughness of the pipe caused by corrosion. A higher suction pressure (and, thus, a lower required head or specific energy) will result in a lower energy cost for pumping. The amount of savings depends upon the degree of the roughness improvement; an internal coating provides optimum results.
Keeping a pipeline in top condition also enables more efficient product movement, and boosts safety and quality.
ANDY SANTALUCIA is Houston-based Manager, Pipeline Services, for Clean Harbors. E-mail him at [email protected].


