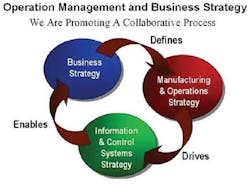
Figure 1. The control strategy links the business strategy and the manufacturing strategy.
A little more than a decade ago, a group of mid-level managers of The Lubrizol Corp. rallied around a more holistic approach to close the gap between data and analysis to identify opportunities for eliminating waste, increasing production and boosting profitability. Today, that original vision remains intact, and what became institutionalized as the Operations Management System, or OMS, is enhancing relationships with vendors, improving productivity and contributing in meaningful ways to operational excellence.
Beyond reporting
From the outset, the over-riding goal of the OMS working team was to improve the efficiency of data utilization — not simply to report data. Analysis was key — to look for relationships and correlations, identify where variability was coming from, and act upon those results to further improve business dynamics and economics, product quality, throughput and time cycle while cutting variability and waste (Figure 2). Moving an organization from a data collection, data reporting mindset to an analysis mindset improves business and production knowledge.
Figure 2. Changing the mindset from data collection to data analysis increases profits.
The challenge for the OMS team was to gather the data being generated by disparate systems — from a variety of distributed control systems — and integrate the data across those systems. Every process was fair game. Targeted areas included production operations, maintenance, engineering and instrumentation, analytical lab results, environmental systems, asset management instrumentation, process control, calibration, quality assurance data, demand forecast linked to production planning, equipment and processes, and business data.
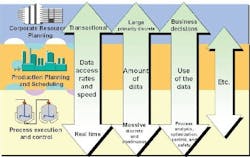
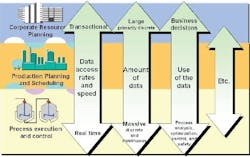
An early observation was that different departments have different needs for the same data. For example, compare the needs of a business group versus those of an operations group. The business group must know the inventory, i.e., how much material of each component was used to manufacture a batch of product. In addition, they require data on the quality characteristics (purity, properties, etc.) for making the product. The operations group must know exactly how each component will be added during the manufacture of a batch (the recipe), the quality characteristics of the component and the inventory quantities. How each component is used is necessary for correlating process dynamics to batch yield, conversion costs, and resulting impact on product quality. Thus, the needs of each group must addressed differently (Figure 3).
Figure 3. The same data serve many distinct requirements at different levels.
History lessons
During the planning phase of the initiative, the team identified the need to establish a process historian. A historian is a database of time-related data such as temperatures, pressures, levels, device characteristics, quality and comments, all stored with a timestamp. It allows the review and analysis of such data. Trends can be identified and values searched and exported to various data analysis and reporting tools. Historically, much of the data that existed was in written form or stored in local systems. Thus, it required painstaking manual work to access important information and properly format it. The process historian helps address some of these problems.
After developing product selection criteria for the historian, and reviewing the offerings of a number of vendors, the OMS team selected the OSIsoft PI system as the corporate standard. Prototype implementation began at manufacturing facilities in the United States and Europe. Sensors were installed at key points in each facility’s manufacturing equipment and were wired back to controllers, such as a distributed control system (DCS), programmable logic controller (PLC) or data logger.
Once in place, the PI scanner essentially watches “tags” for certain criteria, usually a value change of a certain magnitude, at a particular frequency. These tags are pieces of data on the control system. When the criteria are met, the data and time-stamp are sent to the PI server. Whether a value (data and time) should be compressed and stored was determined by additional criteria configured in the server.
Non-critical information is discarded, allowing the basic fingerprint of what happened to be captured without requiring all of the data to be stored, thus efficiently using the disc. Users of the system can then access the PI server, or servers, that contain the data they wish to review. In the event of a quality concern, the data repository helps users determine how a particular product batch was made.
Once sorted and stored, data become available as input. Lubrizol could then move on to the next step: implementing data analysis tools to uncover process relationships, characterize process variability and correlate process dynamics. These tools are used to develop economic and product quality parameters.
Standardization and collaboration
Analysis tools are only useful if manufacturing processes are automated. After developing a strategy for success, the next step was to transition older, non-instrumented processes into controlled processes. A milestone was the decision to standardize on one DCS provider for the Lubrizol additives business. Another was the conversion of various legacy systems to the new global standard. Emerson’s DeltaV digital automation system was selected.
Since then, a true collaborative relationship has grown between Lubrizol and Emerson; Emerson representatives now serve as active members of the OMS team. This has resulted in two-way benefits. Lubrizol is sharing its process optimization and data analysis knowledge with Emerson; Emerson is contributing its process control expertise in return. A number of collaborative development projects have been spawned. Lubrizol is committed to assisting with field trials and to adopting new Emerson systems that improve manufacturing processes. Commercial agreements are now in place not only for the DeltaV platform but for Emerson’s Rosemount, Micro Motion and Fisher Valves divisions as well. Lubrizol has also standardized on aspects of Emerson’s PlantWeb digital plant architecture.
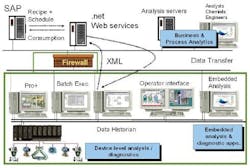
The planning and prototype implementation phase to integrate DeltaV with the SAP enterprise resource planning (ERP) system — known informally as the “run-the-unit” phase — was largely completed by late 2005; standardization continues. Several, prototype manufacturing units now employ this automated integration. In these modern units, vertical information flow is established. Business recipes, schedules for execution at the shop floor, timing for feedstock deliveries, and such, flow downward. Material consumption, batch yield and production times are passed upward to the SAP ERP system. More units are slated for vertical integration. Going forward, the focus of planning is shifting to horizontal integration — the “analyze-and-improve-the-unit” phase — of the data streams with a statistical data analytics tool kit that includes such tools as Statgraphics, by Statpoint, Inc., Simca, by Umetrics, and SAS, by the SAS Institute. This vertical and horizontal integration is visualized in Figure 4.
Figure 4. Interfacing people to analysis and optimization tools requires a thoughtful scheme.
Bottom-line benefits
Tangible benefits of the OMS initiative have been accumulating. For example, at the Painesville, Ohio, plant, a reactor cooling problem was affecting plant reliability. The heat load was higher than the design load in the beginning of the exothermic reaction. Luckily, the process was highly automated, although this seemed to have added to confusion. “We experienced many delays due to high temperature shutdowns of the feeds during the early stages of the reaction,” says Mike Mozil, processing specialist for Intermediates at the Painesville plant. “The unit we reviewed was under DCS control and highly instrumented. Unfortunately it was very difficult and time consuming to manually retrieve the data for analysis.”
In this case the data historian became the data repository. After interfacing with the data historian, the Painesville team then had access to the data to study the reaction as well as the air cooler in great detail. The data showed that the air cooler was the heat transfer bottleneck and was, as originally suspected, not effectively cooling the coils. Mike indicated that “the data also showed that a considerable amount of reactor time was spent venting residual pressure between batches.”
To solve the problem, an additional air cooler was installed and procedures were changed to speed the venting. As a result, the unit’s capacity was increased by nearly 20%, leading to annual savings of more than $420,000 from reduced imports of a key component.
The same plant also improved the safety of its aluminum oxide oxidizers after data analysis revealed conditions under which the reaction slowed, or stopped. The addition of an oxygen sensor, now monitored via DeltaV, allows the process to be safer and more efficient.
At Lubrizol’s Dear Park, Texas, manufacturing facilities, loop optimization, alarm management and advanced controls initiatives are in place. This effort is bearing early fruit. Efren Hernandez, process control engineer at the plant, collaborated with Emerson Performance Solutions on a loop optimization study for a key manufacturing unit. The study focused on current instrument performance, existing control strategies and loop process dynamics. The analysis resulted in energy savings of approximately $45,000 a year based on 2004 prices.
Other Lubrizol plants are benefiting from the OMS initiative. In LeHavre, France, the availability of accurate, real-time information is improving H2S monitoring. Operators in the Houston plant no longer log environmental data for abatement equipment in 15-minute intervals. With electronic data captured on production spreadsheets, engineers can now analyze processing and quality assurance data in the same database. Problems can be identified faster and resolved with less guesswork.
On a broader basis, a corporate-wide focus team is drawing upon all of the data systems. The team is building and utilizing large data sets as it systematically analyzes all aspects of product lines. The initiative includes the study of the economic factors, environmental conditions, process variability, quality assurance data and customer feedback. Once a study is complete, the team is able to characterize the various relationships and process dynamics and make adjustments that will improve efficiency or reduce costs. These are but a few of the countless examples where improvements are having a positive impact on the corporation’s bottom line.
Operational excellence
The OMS initiative is well on its way to delivering the benefits of operational excellence that were envisioned a decade ago. It is the infrastructure for process improvement. It has reduced variability while consistency in quality has improved. Yield is on the rise and time cycles are decreasing. The OMS team is empowering people, from the shop floor to corporate headquarters, to perform process studies and process optimization. The dream of efficient manufacturing processes is coming true.
Robert Wojewodka is Technology Manager at Lubrizol, Wickliffe, Ohio. E-mail him [email protected].


