Put The Bull And Bear In Clean Energy
Researchers from Texas A&M University, Collage Station, Texas, have devised a predictive framework known as the energy price index (EPIC) that reflects changes in energy prices resulting from the type of energy sources available and their supply chains.
[pullquote]
Such a tool is needed, they say, for several reasons. For example, energy markets are sensitive and volatile to technological innovations, changes in monetary and fiscal policies, major global events, and consumer trends.
At the same time, important strategic, political and commercial decisions and their associated policies are assessed in economic terms, so accurately evaluating the price of energy is crucial.
Similar to how the Dow index reflects trends in the stock market, the new metric can calculate and forecast the average price of energy in the United States.
“Energy is affected by all kinds of events, including political developments, technological breakthroughs and other happenings going on at a global scale,” says Stefanos Baratsas, a graduate student in chemical engineering at Texas A&M and the lead author on the study. “It’s crucial to understand the price of energy across the energy landscape along with its supply and demand. We came up with one number that reflects exactly that. In other words, our metric monitors the price of energy as a whole on a monthly basis,” he adds.
Writing in a recent issue of Nature Communications, the researchers point out that while targets are being set for the use of renewables in the overall energy mix, up to now there hasn’t been a way to quantitatively and accurately measure the price of energy as a whole.
EPIC takes a three-pronged approach to overcome this. Firstly, it represents the average price of energy in the United States over the entire energy landscape, covering all the different energy sources and feedstocks (non-renewables and renewables), as well as the end-use sectors.
Second, the proposed formulation collectively captures the two key attributes of energy: the supply and demand mechanisms along with the prices of the energy feedstocks and products across the entire energy landscape. The authors note here that other methodologies in the literature generally focus on specific energy sectors.
Lastly, the forecasting ability — called excellent by the authors — of the proposed mathematical framework allows estimating the current value of EPIC and, thus, the current price of energy, overcoming the issue of the non-availability of actual data. It also can be used to forecast future values of energy demand accurately.

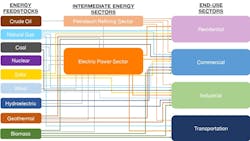
Figure 1. The energy sector is marked by complex supply chains between energy feedstocks and consumers. Source: Stefanos Baratsas/Texas A&M Engineering.
They put EPIC into practice on two real-life policy case studies.
The first looked at crude oil. Here, the researchers parametrically examined the effects of a crude oil tax ranging from $2.50/bbl up to $25/bbl, while noting that in 2016 President Barack Obama proposed a $10.25/bbl tax to support new transportation systems designed to reduce carbon emissions and congestion.
EPIC calculated the amount of potential revenue such a policy could generate from January 2003 until June 2020 — finding it could produce around $148 billion in four years for every $5/bbl increase in crude oil tax. Also, this tax wouldn’t significantly increase the monthly cost of energy for U.S. households.
President Obama’s proposed increase in crude oil tax would have raised $284 billion over four years while raising monthly energy-related expenses per household by $76.90, or 5.54%.
The second case study explored the effect of subsidies in the production of electricity from renewable energy sources including hydroelectric, biomass, geothermal, solar and wind. It found that such policies can cause a dip in energy prices even with no tax credit.
Baratsas says their approach offers a way to optimize policies at the state, regional and national level for a smooth and efficient transition to clean energy. Further, he notes their metric could adapt or self-correct its forecasting of energy demands and prices in the event of sudden, unforeseen situations, such as the COVID-19 pandemic, that may trigger a drastic decrease in demand for certain energy products.
“This metric can help guide lawmakers, government or non-government organizations and policymakers on whether, say, a particular tax policy or the impact of a technological advance is good or bad, and by how much,” says Stratos Pistikopoulos, director of the Texas A&M Energy Institute and senior author on the study. “We now have a quantitative and accurate, predictive metric to navigate the evolving energy landscape, and that’s the real value of the index,” he concludes.

Seán Ottewell is Chemical Processing's editor at large. You can email him at [email protected].