Fire And Explosion Protection: Take Note Of Revisions To TR-84.00.07

Technical report “TR-84.00.07-2018, Guidance on the Evaluation of Fire, Combustible Gas, and Toxic Gas System Effectiveness,” published by the International Society of Automation (ISA), Research Triangle Park, N.C., is one of the best sources of knowledge about reducing the risk associated with stored chemical energy that can result from loss of containment and the subsequent consequences. It first came out in 2010; a revised version appeared in 2018.
While prescriptive approaches are recognized and generally accepted good engineering practices for consistent and controllable applications, they still should be based on risk analysis and sound engineering principles. The technical report deals with the hazard scenarios that are inconsistent, unpredictable and high risk, requiring a performance-based engineering approach to improve the design, provide effective coverage, and lower probability of failure on demand. The principles laid out in the report can serve to establish prescriptive approaches as long as the zone, area, equipment and material in containment are consistent with the risk used to engineer the solution.
The latest version clarifies and expands on the initial report in several areas as knowledge of fire and gas performance-based engineering continues to improve. It provides additional information and examples to explain some of the concepts initially developed. In this article, we will focus on the major changes in the latest version. Realize, however, the detail provided here falls short of that contained in the actual document.
The key information about fire and gas system (FGS) design appears in Sections 4 and 5, with annexes explaining in much more detail some of the engineering methods cited in those sections.
Section 4, “Risk Concepts in FGS Design,” provides an overview on risk concepts that is a must read, otherwise the rest of the document will be confusing.
Section 4.1, “Performance-based FGS Design Process,” contains a useful diagram (shown here as Figure 1) that highlights each of the 11 steps in the process. The section also includes a significant, but easily overlooked, note that “Steps 7, 8, 9 and 10 may require iteration to meet performance targets.”
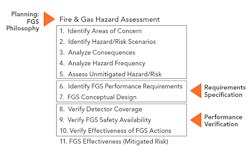
Figure 1. This approach includes steps for both specification and verification.
Section 4.2, “Planning: Fire and Gas [System] Philosophy,” describes the FGS philosophy as a technical basis that establishes the goals for hazard detection and mitigation. If an end user lacks a specific philosophy for an FGS, then its engineering firm should help create one to enable verifying the performance of the proposed design meets the end user’s requirements. The FGS philosophy should contain direction regarding items like the magnitude of hazards the detection equipment should be designed to spot and what actions are required of the FGS to successfully mitigate the hazard.
The technical report continues with three sections to help the reader refine FGS philosophy requirements and considerations: Section 4.3, “Fire Detection Philosophy;” Section 4.4, “Flammable Gas Detection Philosophy;” and Section 4.5, “Toxic Gas Detection Philosophy.”
Section 4.6, “Fire and Gas Hazard Assessment, Requirements Specification, and Performance Verification,” discusses that the initial concept of a lifecycle was redefined as a project workflow. It covers semi-quantitative and fully quantitative risk-analysis strategies used to determine the performance targets. I’ll assume you understand fully quantitative and explain semi-quantitative as similar to Layer of Protection Analysis (LOPA), using lookup tables and order-of-magnitudes selections instead of the detailed math in a full quantitative analysis. A new Annex A describes in detail a semi-quantitative performance target selection technique, as we’ll discuss later.
Subsections 4.6.1 through 4.6.11 define in detail the project workflow, shown in Figure 1, for performing the hazard and risk analysis for an FGS.
Section 5, “FGS Engineering Activities in a Project Workflow,” points out how the engineering activities occur at different stages of a project, including design, implementation, operations, and periodic assessments and audits to ensure the system is functioning as expected throughout its life.
Annex A
The report explains that the risk of fire and gas hazards can be evaluated using a semi-quantitative method to determine the performance targets fundamental to understanding the detection, alarming and mitigation objectives of the FGS and ensuring it meets those objectives.
The new Annex A, “A Sample Semi-Quantitative Performance Target Selection Technique,” walks you through a methodology using a scoring system developed for a hydrocarbon processing facility with fire, combustible gas, and H2S toxic gas hazards. Similar to a hazardous area classification like Class 1 Division 2, this semi-quantitative approach will determine the requirements for different levels of detector coverage based on the risk associated with the specific situation. So, using it will help ensure you invest the correct amount of effort, time and money the risk warrants.
Hazard ranking is a function of many variables like, for instance, the type of equipment. A pump will have a greater likelihood of leaking than a storage tank. Ranking requires evaluating each equipment item in an area of concern for variables like the material in containment, process conditions, the type of equipment, consequence severity, likelihood characteristics including ignition sources, and occupancy. A diagram in the report clearly lays out the hazard ranking procedure.
Working through that procedure involves making adjustments until you get to a final hazard ranking. If the end user has data that show its equipment leaks more or less frequently than the data used to build your lookup tables and order-of-magnitudes selections, then you should switch to a full quantitative risk assessment.
As you perform the procedure and make the adjustments required, you eventually get to a hazard rank, then determine the need for an FGS, and the performance targets for each fire, combustible gas, and toxic gas (in the cited case, H2S only).
The performance targets are Grade A, B or C in this example and, based on the end user’s FGS philosophy, will represent detection coverage requirements. For instance, a Grade A ranking often will require 90% coverage, Grade B 80%, and Grade C 60%. Grade A typically is assigned to areas where the risk of a small toxic gas release could endanger life or result in a fire or significant combustion due to the specific situation.
Subsection A.8.3, “Toxic Gas Detection Performance Targets,” has an excellent description of a toxic gas philosophy that describes the purpose of fixed toxic-gas detection equipment to prevent personnel from entering an area and personal toxic-gas detection equipment to alert them to evacuate an area.
Annex B
This annex, “Detector Coverage Assessment Techniques,” was expanded significantly to add more information about geographic and scenario coverage.
Section B.2, “Criteria for Fire (Geographic) Coverage Assessment,” explains the process of determining geographic fire coverage. It notes that significant variables like field of view, distance, obstacles, radiated energy, and wavelength, as well as detector capabilities can affect the calculations; the annex adds information to better understand these variables. It also discusses voting arrangements and how they further complicate the calculation of coverage. This complexity has prompted most engineers to use fire-and-gas mapping software to perform the calculations for geographic coverage assessments.
Section B.3, “Criteria for Gas (Geographic) Coverage Assessment,” points out that geographic gas coverage is both simple and complex. The end user’s FGS philosophy should define the size, shape, and concentration of the gas cloud to detect. Then, theoretically, you place detectors in an array at the necessary elevation based on the characteristics of the material in containment to ensure a specified cloud cannot exist in the area of concern without detection at the percentage of coverage you determined earlier as a Grade. The annex also explains a point exists where more detectors add very little percentage of coverage and, therefore, it is important to stop adding detectors once you reach the coverage percentage at the required elevation(s).
The section discusses the size and shape of the cloud. In practice, many engineers have simplified the gas cloud to a 5-m-dia. sphere based on analysis done by the U.K. government’s Health and Safety Executive after the Piper Alpha accident; this is where the concept of the 5-m2 detector grid originated. Placing detectors on the corners of the grid enables spotting a gas cloud before it reaches 7-m diameter. The annex also includes some discussion about changing the gas cloud characteristics based on the circumstances.
In addition, it lists the procedure and attributes of gas-detector coverage assessment.
Section B.4, “Detector (Scenario) Coverage Assessment,” explains that scenario coverage is a more-detailed evaluation than that of geographic coverage. This is because it considers risk scenarios, consequences, and event likelihoods in the coverage assessment.
By identifying fire and gas scenarios and overlaying them on the area of concern appropriately, scenario coverage seeks to determine if the required (grade-based) percentage of scenarios is detected instead of the determining if the geographic area is covered.
This section outlines the procedure for both fire and gas (scenario) coverage.
Section B.5, “Factors Considered When Developing Detector Layout,” is dedicated to helping the designer of the detector array understand the factors affecting coverage and risk. It discusses a host of variables the designer must consider when creating a detector array.
The section covers scenario characteristics inside a space like a building or highly obstructed area versus outside. Inside a space, the air handling equipment typically has the biggest impact on where a gas release will move and the shape of the cloud, while the prevailing wind has the greatest effect outside. It also gets into other considerations regarding equipment and flammable material as well as detector technologies and voting.
Annex C
This annex, “Mitigation Action Effectiveness Concept,” is new in the 2018 version. It explains that mitigation effectiveness basically expresses how confident you are that activating the final element will successfully mitigate the consequence. It points out the usefulness of showing mitigation effectiveness as a single value in the FGS effectiveness model to illustrate the general risk concepts (Figure 2).
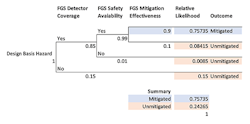
Figure 2. Use of a single value can indicate the impact of general risk concepts.
However, mitigation effectiveness can’t be collapsed into a single value. Instead, if modeled quantitatively, mitigation effectiveness is a large collection of event tree branches that describe the range of mitigation actions possible upon detection of a fire or gas event and the probability of success of each of these actions coupled with the amount of risk reduction provided under each scenario.
Questions to consider in determining the amount of mitigation achieved might include:
• What is the probability the FGS will extinguish the fire? This probability is a function of the size of the fire that occurs and other contributing factors. Failure to extinguish the fire might stem from: a fire size in excess of the design basis; excessive air movement removing the extinguishing agent too rapidly; and inadequate accumulation of the extinguishing agent.
• If the automatic fire extinguishment system fails, will an operations staff member manually extinguish the fire with handheld equipment?
• Will the staff member suffer injury while attempting to manually control the fire?
• If the automatic fire extinguishment system does operate effectively, will operations staff be injured if they enter the area too soon?
The complex series of events represented by a single value in the FGS effectiveness model actually is an event tree as shown in Figure 3. When selecting performance targets, the way that mitigation effectiveness is addressed depends on whether fully quantitative or semi-quantitative methods are employed.
The fully quantitative approach calculates risk using an event tree to quantify all potential outcomes of a loss-of-containment accident. To address mitigation effectiveness, the event tree explicitly contains all factors upon which the potential consequences rely. This would require inclusion of the type of information defining mitigation effectiveness in the overall FGS effectiveness model.
The semi-quantitative approach considers mitigation effectiveness during the calibration of the charts, tables and numerical criteria that make up the overall procedure. It does not include any additional explicit consideration of mitigation effectiveness.
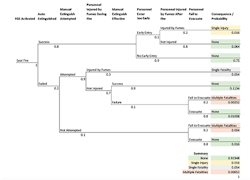
Figure 3. Its complexity clearly points up that many factors contribute to the ultimate result of mitigation efforts.
ANNEX D
This annex, “Application Examples,” is a rewrite of what was Annex A, “Application Example Problems,” in the 2010 version.
Risk is calculated as the product of frequency and consequences. Prevention systems like a safety instrumented system reduce the risk by decreasing the frequency while mitigation systems typically cut the risk by lowering the severity of the consequences.
This section presents detailed examples of fire, combustible gas and toxic gas to illustrate all 11 steps of performance-based FGS design to reduce the risk by well-designed detection and subsequent action as close to incipient stage as possible. The first example is fire detection and suppression in an oil-and-gas-well bay. The second is combustible gas detection in a natural gas production platform. The third is toxic (H2S) gas detection in an onshore gas-processing plant.
Annex E
This annex, “Evaluation of Computational Fluid Dynamics vs. Target Gas Cloud for Indoor Gas Detection Design,” is new to the 2018 version. It was added to highlight the need to analyze the characteristics and movement of a gas cloud consequence in an enclosed or congested space where gaussian modeling might not work. When direct exposure to wind is the primary disrupter, as in many areas of a processing plant or offshore platform, gaussian modeling of a gas leak works well so long as you take into account the prevailing wind direction. However, when the air is very still in a congested space, gaussian modeling analysis might not provide an adequate result. Also, in enclosed spaces where air handling equipment become the primary disrupter, gas clouds move differently based on the air currents in the space. So, this annex considers computational fluid dynamics (CFD) as an alternative method of gas cloud consequence modeling.
The annex cautions that CFD modeling is complicated and the equations used have limitations requiring well-practiced engineering judgement to handle buoyancy, momentum, or thermal-driven fluid flow characteristics.
A Valuable Resource
Industry has learned a great deal applying the principles described in ISA TR84.00.07-2010. The new version incorporates the engineering knowledge gained into excellent guidance for performance-based FGS design. It’s a reference you should consider acquiring and reading.
JIM MCGLONE is a consultant and chief marketing officer of Kenexis, Columbus, Ohio. Email him at [email protected].