U.S. Chemical Industry Soars
Economic growth in the United States remained dynamic at the end of 2018 with gains in manufacturing double what they were a year ago. However, all the world’s other major economies have slowed, ending a rare period of synchronized expansion.
In the United States, business investment is on the rise and domestic oil and natural gas production continue to reach new heights. Improvement in major end-use markets is setting the stage for gains in U.S chemical production during 2019. U.S. chemical manufacturers remain advantaged, with access to cheaper and more abundant feedstock and energy. This has resulted in sizable capital investment in U.S. chemical production capacity. As these investments have been coming online, chemical production volumes, particularly in basic chemicals, continued to improve in 2018, with significant boosts expected in 2019 and 2020.
The Macro Economic Outlook
In the United States, gross domestic product (GDP) grew 2.9% during 2018. Improving business investment combined with strong consumer spending aided GDP growth. In 2019, growth should decelerate to a 2.6% pace, with a further slowing in 2020 and 2021. Factors such as demographic and policy changes should restrain long-term growth in the economy. However, the U.S. chemical industry will be a source of strength as its customer industries and emerging markets improve and as the effects of enhanced feedstock competitiveness bolster growth.
The recovery in the oil and gas sector — and the concurrent improvement in related investments — was a leading factor behind 2018’s stronger economic growth figures. With the recent decline in oil prices, investment may slow in 2019. In addition, rising trade tensions are weighing on business and consumer confidence. The tax reforms enacted at the end of 2017 created a more favorable environment for business investment, which was robust during 2018. The need to enhance productivity and competitiveness will foster continued gains in business investment in 2019 and 2020. U.S. economic growth also reflects strength in consumer spending. Since the end of the recession, growth remained below its potential as high taxes, debt, regulatory burdens and economic policy uncertainty undermined both business and consumer confidence. In 2017 and 2018, this changed for the better as policy reforms were implemented. However, rising uncertainty over trade policy could create headwinds.

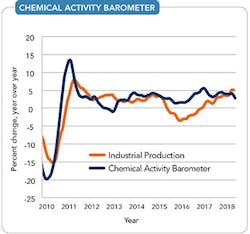
Figure 1. A leading indicator of the U.S. economy, it signals moderating growth.
The trend shown in the Chemical Activity Barometer (CAB) of the American Chemistry Council (ACC) points to modest growth in the U.S. economy. The CAB is a composite index of economic indicators that track the activity of the chemical industry. Due to its early position in the supply chain, chemical industry activity leads that of the broader economy, so the CAB provides an indication of potential turning points in the overall economy. Currently, the CAB is signaling continued — albeit moderating — growth in the U.S. economy through the 3rd quarter of 2019 (Figure 1). As already mentioned, demographics and policy will mute long-term growth in the economy but tax reform and regulatory rebalancing will go far to support U.S. economic dynamism and performance.
Outside the United States, the synchronized upswing among major and regional economies is unraveling (Figure 2). World trade volumes rose 4.5% in 2018 but tariff and other trade policy tensions present formidable risks. Global manufacturing, which rebounded in 2017, moderated in 2018. Europe clearly has slowed and the outlook for Asia has weakened as well. However, Latin America may be recovering. Growth in India will continue to outpace that of China, which is suffering from problems such as overcapacity in manufacturing. Overleveraging in China remains a concern, as does mounting trade tension. Although growth in the global economy reached its long-term trend, the next several years present many challenges.
Domestic Production Dynamics
U.S. industrial output was on a roll in 2018, up by 3.7%, about double the 2017 pace after back-to-back years of decline due to weak export markets, a high dollar, and fallout from the collapse in oil prices. With economic growth around the world decoupling and rising trade tensions, the global appetite for U.S. exports may abate. Renewed investment in oil and gas and housing has stimulated production through related supply chains. The recovery in business investment also has led to broad-based gains across multiple manufacturing industries. Industrial output should moderate slightly in 2019 and 2020, with growth of 2.7% and 2.2%, respectively.
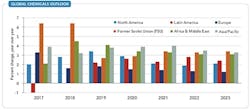
Figure 2. Growth in the United States will remain stronger in relative terms than in many other economies.
Light vehicles represent an important market for the chemical industry (more than $3,250 per vehicle). U.S. light vehicle sales edged lower to 17.1 million units in 2018 and will ease further to 16.8 million in 2019 (Figure 3a). While continued job and income gains are positive factors, they can’t compensate for the loss of pent-up demand, now largely satisfied, that fueled vehicle sales in recent years. Furthermore, credit issues are starting to emerge. The outlook is for sales to remain at slightly lower but still elevated levels over the next several years.
Housing also is a large consumer market for the chemical industry (about $15,000 per start) and steady gains continue (Figure 3b). Inventories remain low and employment and wage gains continue to support demand for homebuilding. However, land and labor constraints provide headwinds in many parts of the country. Housing activity improved to 1.27 million starts in 2018 and will rise to 1.34 million in 2019 as the level of activity gradually returns to its long-term underlying demand pace of 1.5 million units per year by 2023, 16 years after the housing market started to collapse.
With gains across a wide set of chemicals-consuming industries, output of chemicals grew strongly in 2018. Despite trade tensions, exports of chemicals remained robust through the end of the 3rd quarter of 2018. At the same time, new shale-advantaged chemical production capacity started to come online. As a result, output of chemicals (excluding pharmaceuticals) rose by 3.1% during 2018. The U.S. economic outlook should remain resilient through 2019 before downshifting to a more moderate growth path after 2020. With a decisive competitive advantage in energy and new capacity continuing to come online, the outlook for the U.S. chemical industry remains strong. Chemical output should grow by 3.6% in 2019 and 3.1% in 2020. Capacity utilization should slip during the next few years, from 73.2% in 2018 to 71.9% by 2023, as new plants and expansions start up.
Shale gas has created a definitive advantage for U.S. chemical manufacturing. Looking ahead over the next five years, production from the unprecedented investment in U.S. chemical manufacturing will continue to come online, with the largest gains expected in 2018 and 2019. Investment in new capacity continues at a strong pace through the forecast horizon of 2023. Exports are key to industry growth over the next decade as rising growth and living standards across the world will fuel demand for chemicals and plastics.
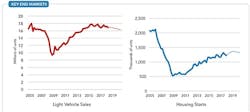
Figure 3. Light vehicle sales in the U.S. will slip but housing starts will continue to climb.
Overall chemical production grew across all U.S. regions during 2018. Over the next five years, the most dynamic growth will occur in the Gulf Coast, followed by the Ohio Valley. Chemical industry revenues should surpass $700 billion by 2023.
U.S. basic chemicals continue to enjoy a competitive advantage from shale gas, improved end-use markets and new capacity that has recently come online. Basic chemicals (inorganic chemicals, petrochemicals, plastic resins, synthetic rubber and manufactured fibers) production likely increased by 2.1% in 2018, and should grow by another 4.8% in 2019 and 4.3% in 2020 before easing to below 3% after 2020 as the pace of new capacity expansion slows (Figure 4). These growth rates compare to an average 0.5% increase per year over the previous two decades. Led by strong gains in bulk petrochemicals and organics as well as plastic resins, exports will play a large role in expanding production. Major export markets include Latin America, Asia and, to a smaller degree, Europe. In addition, production of inorganic chemicals and synthetic rubber will show strength.
The U.S. chemical industry continues to benefit from further development of domestic natural gas and natural gas liquids resources, which it uses for both fuel and feedstock. According to the U.S. Energy Information Administration, ethane production averaged 1.72 million bbl/d in 2018, double the output level just eight years ago. Continued increases in production of these resources is the foundation for positive growth in basic chemicals over the next decade.
In the specialties chemicals segment, production rose 3.7% in 2018 and should grow by 2.2% in 2019. Oilfield chemicals, electronic chemicals, coatings, adhesives, cosmetic chemicals, and flavors and fragrances power these gains. Demand for specialty chemicals should grow in line with industrial and construction sector gains in the years ahead.
For the sixth straight year, the chemical industry added jobs in 2018 — an increase of 5,200 positions (1.2%). Additional job gains should take place through 2023. This trend reverses a continuous decline in employment from 1994 through 2010. Because chemical industry workers are among the highest paid in the manufacturing sector (earning on average $84,000/yr), growing payrolls will strengthen local economies.
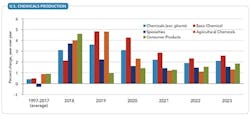
Figure 4. Basic chemicals output will continue to outpace its historic growth rate.
Capital Investment
The United States now is considered an attractive investment location. Reflecting that, petrochemical producers have announced significant expansions of capacity in the U.S., reversing a decade-long decline in the 2000s. In fact, estimates point to a nearly 40% gain in basic olefins capacity during the 2010s. Indeed, over 330 new chemical production projects, together valued at over $202 billion, have been announced through late-November 2018; 68% of these are foreign direct investment or include a foreign partner. The dynamics for sustained capital investment are in place and ACC continues to track the wave of new investment from shale gas.
A new capital spending cycle began in 2010 as chemical manufacturers recovered from the financial crisis and as significant expansions of existing petrochemical capacity — due to new supplies of natural gas — emerged as the driving motivation. As a result, chemical industry capital spending in the U.S. surged 82% in the subsequent eight years, reaching $37.0 billion in 2018. During recent years, the chemical industry has accounted for nearly one-half of total construction spending by the American manufacturing sector. Despite the hindrance of slow global growth, economic uncertainty, and historical U.S. tax policies that discouraged business investment, these strong gains in chemical industry capital spending should continue. The Tax Cuts and Jobs Act enacted late in 2017 will support investment. U.S. chemical industry capital spending increased by 7.9% this year but should average 4.7% in 2019 and 3.4% in 2020 as many early projects reach completion. Growth should moderate further in 2021 and 2022 but resume in the period after that as recent project announcements approach key spending periods. By 2023, U.S. capital spending by the chemical industry will reach $43 billion — nearly twice the level of spending at the start of this prolonged cycle in 2010 (Figure 5).
Investments for bulk petrochemical and organic intermediates as well as for plastic resins will dominate. Spending for process equipment, instrumentation, and structures present strong opportunities during this period.
Balance Of Trade
Despite the imposition of tariffs, the strong growth of the U.S. economy has maintained demand for imports. However, economic deceleration in foreign markets and substantial retaliatory tariffs pose a serious threat to U.S. chemical exports growth. (For details on an ACC analysis of the potential impact of a trade war with China, see: “Trade Wars Create Collateral Casualties.”) The U.S. chemical industry posted a $39 billion trade surplus in 2018 as exports (on a dollar basis) rose 10.0% to $143 billion and imports climbed 7.8% to $105 billion. Overall, the outlook for U.S. chemicals exports remains positive as U.S. producers remain relatively advantaged with access to cheap and abundant feedstocks and energy and new production comes online in the coming years. Assuming no further disruptions to the trade scenario, the U.S. in 2023 will enjoy a $69-billion trade surplus in chemicals, driven by a $65-billion trade surplus in basic chemicals.
In the global chemical industry, the decoupling of economic growth as well as weakness in China and moderated activity in Europe clearly affected production levels. Overall global chemicals production likely advanced 2.8% in 2018, off from 2017’s 3.2% pace. Prospects should marginally improve during 2019, with global chemicals output rising 3.0%. However, gains should moderate to 2.4% by 2023. In the long term, the developing nations of Asia-Pacific, Africa and the Middle East should show the most dynamism but growth should be strong in North America as well. With long-term structural and competitiveness challenges, Europe and Japan should lag. However, the slow growth Latin America and some other emerging markets are experiencing should be more short-term. With strengthening production volumes, global capacity utilization should improve through 2020. However, as more capacity comes onstream, operating rates should ease slightly in the 2020s.
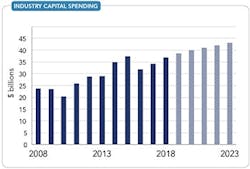
Figure 5. Investment should reach $43 billion in 2023, about twice the level of 2010.
Favorable Forecast
The U.S. chemical industry now is set for significant growth in output as new production capacity comes online and demand strengthens in key end-use markets in the United States. Significant additions to capacity will result in above-trend growth in basic chemicals through 2023 in addition to solid output growth in other segments.
The United States continues to enjoy a competitive advantage from shale gas and abundant new supplies of natural gas liquids. More than half of the chemical industry investment announced since 2010 has been completed or is currently under construction. As new production expands to meet growing global demand, employment in the chemical industry will accelerate further. The industry likely will continue adding high-paying jobs through the end of the decade. Provided that access to export markets remains open to U.S. producers, shale-advantaged chemicals sourced from the U.S. will play a key role in meeting expanding global demand.
KEVIN SWIFT is chief economist and managing director of the American Chemistry Council, Washington, D.C. MARTHA GILCHRIST MOORE is senior director, policy analysis and economics, for the American Chemistry Council, Washington, D.C. Email them at [email protected] and [email protected].