Build An Effective Condition-Monitoring Program
Most chemical companies appreciate the potential value of the Industrial Internet of Things (IIoT) for enhancing profitability. Many realize, for instance, that using instrumentation and software to monitor asset condition and performance can reduce costs and increase availability. However, the quest for a digital transformation can founder if initial efforts don’t provide clear business results.
So, it’s crucial for a plant manager wanting to take advantage of the IIoT to select a demonstration project with limited costs and a quick payback. This is the time to pick some low-hanging fruit rather than to tackle the most challenging project.
Unfortunately, hurdles can arise in financially justifying such a monitoring project because its expected return on investment (ROI) isn’t always clear; mechanisms for improving asset performance by condition monitoring focus on cost avoidance rather than creating an income stream. Implementing asset monitoring using IIoT concepts doesn’t help to directly increase production in all cases, at least not by changing capacity in any clearly quantifiable way, but often raises availability. For the most part, asset monitoring reduces the amount of maintenance and repair along with associated costs.
For example, take a medium-sized centrifugal pump application so critical that it requires installation of one or even two standby pumps to handle the service in the event of a failure — but lacks any permanent monitoring equipment. Consider:
- How many times in the last year has one of the pumps failed in operation?
- How much more did it cost to repair the installation after a failure than it would have cost to fix the problem before the breakdown?
- How frequently has following a maintenance schedule led to taking a pump out of service only to discover that it doesn’t need work?
- How often has a failed pump remained sidelined for an extended time because the required parts to repair weren’t available?
These are the kinds of costs that asset monitoring can avoid or at least mitigate. More importantly, though, monitoring increases production by raising availability and avoiding unscheduled outages. The ability to boost production by even a fraction of a percentage point over the course of a year can pay for a lot of monitoring equipment. However, again, this can be difficult to quantify in dollars because it’s tough to determine how much overall availability will increase.
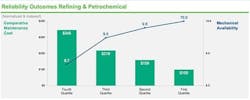
Nevertheless, a major study provides some interesting data. In its 2013 “International Study of Plant Reliability and Maintenance Effectiveness” (also known as the “RAM Study”), Solomon Associates divided refining and petrochemical companies into quartiles based on reliability outcomes, using comparative maintenance cost and mechanical availability as two metrics (Figure 1). Basically, the study asked how much a plant spent on maintenance, and how much time was lost due to outages.
The differences in performance are dramatic. For maintenance costs, first-quartile companies spent less than one-third of those in the fourth quartile and less than half of third-quartile plants. More-effective maintenance planning based on gathering of performance data certainly pays off.
As for mechanical availability, top-quartile performers had 4% higher availability than average performers. What is the value of increasing plant or unit output by 4% without a major capital expenditure project? Probably quite a bit.
Picking Low-Hanging Fruit
As suggested earlier, equipment-monitoring digitalization projects aimed at improved asset performance should begin with something manageable but significant enough financially to get management’s attention. Here are five recommended assets and the types of instruments to use to monitor them:
- centrifugal pumps — vibration, bearing temperature, differential pressure and seal-pot level sensors, and discharge pressure transmitter;
- heat exchangers — inlet and outlet temperature sensors, and flow meters;
- piping and vessel integrity (corrosion) — ultrasonic metal thickness sensors;
- pressure relief valves (PRVs) and rupture disks — acoustic transmitter and wireless pressure gauge; and
- steam traps — acoustic transmitter.
By adding a few basic instruments to these assets, you can monitor performance in real time while collecting data for historical analysis. From a traditional mindset, installing the instrumentation and creating the necessary custom software may sound terribly expensive. Mounting the instruments; identifying or adding new input/output (I/O) points; wiring and terminating cables; and then calling in system integrators to create the human/machine interface (HMI) graphics, interface with the control systems and the historian is indeed expensive. However, many of these tasks evaporate when the right technologies are selected.
Using WirelessHART networks removes the need to run cables or terminate I/O. Many plants already have these networks installed and operating. Because these monitoring data aren’t directly process control related, you don’t have to integrate or even pass them through the plant process automation systems. Instead, they can go directly from the WirelessHART network to asset management applications.
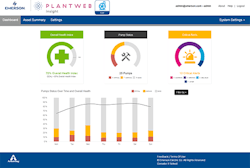
Pre-configured data processing, historization and analysis applications (Figure 2) are available off-the-shelf, eliminating the need for custom integration and control system configuration.
Choosing Where To Start
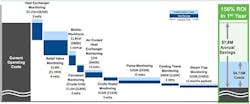
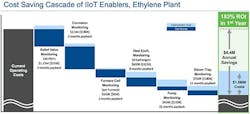
Let’s look at the five areas just mentioned and see what results are possible. We’ll consider two actual and typical facilities: a 250,000-bbl/d oil refinery (Figure 3) and a 570,000-t/y ethylene plant (Figure 4). In both situations, the numbers are based on deploying a basic asset monitoring system as described using WirelessHART instruments on existing networks and then sending the data from these instruments to pre-configured software applications. The payback period cited represents the time needed to recoup the implementation cost.
Centrifugal pumps. Instruments measure vibration (which can be caused by misalignment or bearing deterioration), bearing temperature, pump lubricant level and other parameters. Each motor/pump combination typically gets five instruments; more-critical installations also may include monitoring of the strainer and inlet pressure to detect cavitation.
Pump monitoring offers a substantial payback — a breakeven time of 12 months for the refinery and 22 months for the ethylene plant. If pumps routinely run to failure or maintenance costs seem particularly high, starting here may make sense.
Heat exchangers. Multiple temperature and flow transmitters measure inlets and outlets of the heat exchanger to track the exchanger efficiency and identify fouling. Like pumps, heat exchangers require around five instruments each to provide a complete performance picture. Because poorly performing units incur high maintenance costs and inefficiency penalties, payback times for monitoring can be fast. The refinery recouped its investment in three to four months for each installation. The ethylene plant outfitted ten heat exchangers and found the payback time was eight months. Additionally, tracking real-time efficiency allows shutdowns for cleaning to be done only when the exchanger is shown to have fouled rather than on a scheduled basis. This often can extend the time between cleaning, reducing operational costs and improving availability.
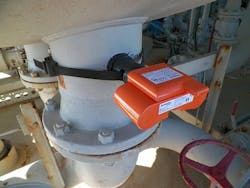
Piping integrity (corrosion). Continuously monitoring the condition of piping and vessels, specifically the metal thickness, can track the effects of corrosion and erosion over time. Thickness measuring probes using ultrasonic technology (Figure 5) can determine wall thickness, avoiding situations where pipes or vessel walls crack and release contents, which can result in fires or environmental disasters. Data from strategically placed and permanently mounted thickness measuring probes can be historized.
While one of the lower cost projects, corrosion monitoring offers a potentially huge payoff if it detects a dangerously thin section before an incident or avoids an unnecessary shutdown. Additionally, analyzing corrosion trends enables optimizing the use of expensive corrosion inhibitors, reducing cost and risk. The refinery installed a large number of probes, so it was a major deployment effort, but the project still paid off in two months. The ethylene plant launched a more modest project on its amine unit but also achieved a payback period of only two months.
PRVs. Acoustic transmitters can detect full openings or continuous slow product release due to poor seating. If a PRV is installed in series with a rupture disk, a wireless pressure gauge can verify that no pressure is accumulating in the interstitial space between the two due to rupture disk degradation that otherwise could become a safety issue.
This also is a low-cost project because wireless acoustic transmitters are relatively inexpensive and easy to install. Typically, they simply mount using metal straps on the section of pipe on the outlet of the PRV. Loss of product to the flare system due to poor sealing adds up quickly. The refinery installed numerous transmitters and found they paid for themselves in six months. The ethylene plant deployed monitors on 150 PRVs and recouped its investment in three months.
Steam traps. An acoustic transmitter can detect the sound of a malfunctioning steam trap, either stuck closed allowing condensate to accumulate or stuck open wasting steam. Given the infrequency with which most plants check steam traps, detecting and fixing a bad one can save a lot of money.
The payback time depends on the amount of steam loss or distribution system disruptions caused by condensate buildup. The refinery and the ethylene plant both made their cost back in 11 months. That payback calculation doesn’t include the effect of pipe blockages and process restrictions caused by inadequate heating of steam lines connected to defective steam traps.
Pain Is The Driver
Use internal pain points to determine where to deploy initial projects. Plant management will welcome you successfully solving problems responsible for losing money, disrupting production or causing maintenance headaches. Relieving operators from manual checking and data gathering will allow them to perform higher value tasks. If you can do these types of projects quickly at low cost and with minimal disruption to plant operations, you will gain a strong impetus to continue on the same path.
The technologies to move companies into the top quartile are available today. Moreover, many of them are easy to use and inexpensive to deploy, certainly compared to traditional methods. So, join the rapidly growing number of chemical companies that understand the importance of this digital transformation. As the digital ecosystem grows, each step becomes easier, adding another layer to increased profitability.
About the Author

Shane Hale
Emerson Automation Solutions
SHANE HALE is the director of business development for wireless technologies at Emerson Automation Solutions, Shakopee, Minn. Email him at [email protected].