The U.S. Chemical Industry Gears Up for Gains
The output of the American chemistry industry held its own in 2017 despite hurricane-caused disruptions. Now, both global and national developments are boosting the industry’s prospects for the next five years. For the first time in a decade, all the world’s major economies are on an upswing in concert. In the United States, manufacturing has turned a corner, business investment is on the rise, and domestic oil and gas production is on the rebound. Major end-use markets, supported by growth in trading partner economies, have improved, setting the stage for gains in U.S chemical production.
Hurricane Harvey halted some Gulf Coast production temporarily and took a bite out of volumes during the third quarter. In addition, inventories are rising, albeit from low levels. Nevertheless, U.S. chemical manufacturers retain advantages from access to cheaper and more abundant feedstock and energy. Reflecting this, significant capital spending is taking place. As the new and expanded facilities from these investments have been coming online, chemical production volumes, particularly in basic chemicals, continued to improve in 2017 — and significant gains are expected in 2018 and 2019.
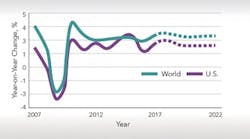
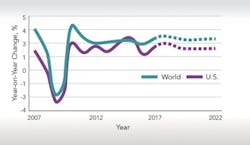
Figure 1. Strength in all major global economies will help propel U.S. growth.
During 2017, agricultural chemicals, coatings and other specialties as well as bulk petrochemicals — due to their renewed competitiveness arising from shale gas — led these output increases. Continued gains in manufacturing and exports during 2018 and beyond will drive demand for basic chemicals, especially those where the United States enjoys a competitive advantage. Improved business activity in domestic end-use markets and exports will support growth for most specialty segments.
[callToAction ]
In the United States, strengthened performance across a broad band of industrial sectors supported economic growth in 2017. Housing, business investment and their supply chains have momentum. The demand for light vehicles softened last year but remains solid. In 2018, investment and industrial activity should strengthen. With rising performance across the world, export markets should expand.
The U.S. chemical industry is undergoing a renaissance as new investments come online and further capital spending plans are announced. These investments will capitalize on the profound and sustainable competitive advantage enabled by shale gas development. In addition, the industry is boosting its employment. Moreover, chemical companies in the United States continue to innovate, focusing on improving efficiencies as well as on new leading-edge product development.
The Macro-Economic Picture
In the United States, gross domestic product (GDP) grew only 2.2% during 2017. Improving business investment combined with an end to the broad inventory imbalance have aided GDP growth. The pace should accelerate to 2.5% in 2018 but growth will remain moderate in the second half of the decade. Factors such as demographics and policy should restrain long-term growth in the economy. Tax and regulatory reform could go far to rejuvenate U.S. economic dynamism and performance, though.
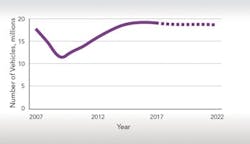
Figure 2. Pent-up demand now largely has been satisfied.
The U.S. chemical industry will be a source of strength in the economic outlook as its customer industries and emerging markets improve and as the effects of enhanced feedstock competitiveness bolster growth.
The recovery in the oil and gas sector — and the concurrent improvement in related investments — is a leading factor behind the stronger economic growth figures. This gain in equity markets in 2017 occurred amid an environment of greater consumer and corporate confidence. This higher confidence and upbeat trends in new orders underpinned recovery in 2017. The need to enhance productivity and competitiveness will foster continued gains in business investment in 2018 and 2019. Ongoing strength in consumer spending also will spur growth. Since the end of the recession, U.S. economic growth remained below its potential as high taxes, debt, regulatory burdens and economic policy uncertainty took a toll on both business and consumer confidence. This appears to be changing for the better — although failure to reform policy could further hamper growth.
The trend seen in the Chemical Activity Barometer (CAB) of the American Chemistry Council (ACC) supports the outlook for modest growth in the U.S. The CAB is a composite index of economic indicators that track the activity of the chemical industry. Due to its early position in the supply chain, chemical industry activity leads that of the broader economy and, thus, the CAB can serve to anticipate potential turning points in the overall economy. Currently, the CAB is signaling continued growth in the U.S. economy through mid-2018. (The CAB appears in the “Economic Snapshot” in each issue of CP.)
Outside the United States, a synchronized upswing among major and regional economies is occurring for the first time since the mid-2000s. World trade is reviving after lagging world GDP in 2015 and 2016. Global manufacturing, which softened during 2015 and 2016, strengthened in 2017. Europe is on a roll and the outlook for Asia is optimistic. However, Latin America remains problematic. India will continue to grow at a stronger pace than China, which is suffering from problems such as overcapacity in manufacturing. Overleveraging in that nation and China remains a concern. Brazil and Russia have emerged from their recessions. More broadly, long-term global growth potential will be reached this year.
End-Use Markets
Industrial output in the U.S. rose in 2017, growing by 1.7% after back-to-back years of declines due to weak export markets, a high dollar and fallout from the collapse in oil prices. With synchronous economic growth around the world, the global appetite for U.S. exports has increased. In addition, renewed investment in oil and gas and housing has stimulated production through related supply chains. The recovery in business investment also has led to broad-based gains across multiple manufacturing industries. Industrial output should strengthen in 2018 and 2019 — with growth of 2.4% and 2.3%, respectively.
Light vehicles represent an important market for the chemical industry (nearly $3,500 per vehicle). Production has eased from 2016’s robust pace because the pent-up demand that fueled vehicle sales in recent years largely has been satisfied. U.S. light vehicle sales retreated to 17.1 million in 2017 and should fall to 17.0 million in 2018, despite continuing job and income gains. The outlook is for sales to progress at a solid, though slower, pace over the next several years.
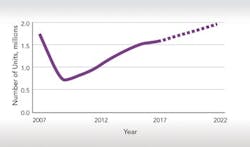
Figure 3. Activity should recover to its pre-housing-market-collapse level.
Housing also is a large consumer market for the chemical industry (about $15,000 per start) and steady gains continue. Inventories remain low and employment and wage gains support demand for homebuilding. However, land and labor constraints are headwinds in many parts of the country. Housing activity improved to 1.20 million units in 2017 and will rise to 1.29 million in 2018 as the level of activity gradually returns to its long-term underlying demand pace of 1.5 million units per year by 2022.
The U.S. Chemical Industry
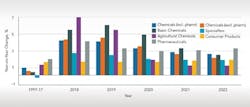
Industrial output rebounded in 2017 across a diverse set of chemicals-consuming industries; export markets also improved. At the same time, new shale-advantaged capacity started to come online. However, in late August, Hurricane Harvey caused widespread — though temporary — disruptions to chemicals production along the Gulf Coast. As a result, output of chemicals (excluding pharmaceuticals) rose by only 0.8% during 2017. With pharmaceutical production off 1.3%, overall output of the chemical industry was flat in 2017. However, due to positive tailwinds from stronger industrial growth around the world and large capacity expansions still to come, the outlook for the U.S. chemical industry remains robust — growth rates should exceed those of American industry overall for the next five years. Chemical output should grow by 3.7% in 2018 and 3.9% in 2019. Capacity utilization should slip during the next few years, though — from 73.8% in 2017 to 72.5% by 2022, as additional production facilities come online. The largest number of plant startups should occur in 2018 and 2019.
Figure 4. Exports of basic chemicals will spur significant expansion in production.
Development of shale gas has created a definitive advantage for U.S. chemical manufacturing that now is prompting a second wave of investment. Much of the new output will go to customers around the world.
U.S. basic chemicals (inorganic chemicals, petrochemicals, plastic resins, synthetic rubber and manufactured fibers) continue to enjoy a competitive advantage from shale gas and improved end-use markets (both domestic and abroad). However, due to Harvey’s disruptions, production remained flat in 2017. It should grow by 4.7% in 2018. With new capacity coming onstream, output should grow by 5.2% in 2019 and 4.2% in 2020, followed by smaller gains in 2021 and 2022. Basic chemicals exports, led by bulk petrochemicals and organics as well as plastic resins, will play a large role in expanding production. Major export markets include Latin America, Asia and, to a smaller degree, Europe. In addition, the demand for inorganic chemicals and synthetic rubber will show strength.
U.S. competitiveness in chemicals improved in 2017. Continued gains in domestic production of natural gas and natural gas liquids ensure ample supplies of fuel and feedstock. At the same time, oil prices and competing naphtha-based production costs increased through the third quarter 2017, expanding the U.S.’s advantage.
In the specialties chemicals segment, production picked up by 3.0% in 2017 and should grow by 2.3% in 2018. Increasing consumption of oilfield and mining chemicals, adhesives and electronic chemicals underpinned the gains. Demand for specialty chemicals should grow in the coming years as the manufacturing and construction sectors accelerate.
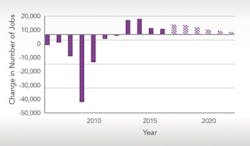
In 2017, for the fifth straight year, the U.S. chemical industry added jobs — an increase of 6,400 positions (0.8%). The building of new capacity will create thousands of jobs across the country. So, additional job gains should occur through 2022. This contrasts to the continuous decline in employment from 1999 through 2011. Because chemical industry workers are among the highest paid in the manufacturing sector, growing payrolls will strengthen local economies.
Figure 5. New investments will underpin an ongoing increase in jobs.
Capital Investment
The United States now is viewed as a favorable investment location. Underscoring this, petrochemical producers have announced significant capacity expansions in the U.S., reversing a decade-long decline in the 2000s. In fact, estimates indicate basic olefins capacity grew by nearly 40% during the 2010s. Moreover, nearly 320 new chemical production projects — with a total value exceeding $185 billion — have been announced through late-November 2017; 62% of these are foreign direct investment or include a foreign partner. The dynamics for sustained capital investment are in place and the ACC continues to track the wave of new investment from shale gas.
A new capital spending cycle began in 2010 as chemical manufacturers recovered from the financial crisis and strove to take advantage of new supplies of natural gas to significantly expand existing petrochemical capacity. As a result, chemical industry capital spending in the U.S. surged 67% in the subsequent seven years, reaching $33.8 billion in 2017. During recent years, the chemical industry has accounted for one-half of total construction spending by the manufacturing sector. Despite the hindrance of slow global growth, economic uncertainty and U.S. tax policies that discourage business investment, these strong gains in chemical industry capital spending should continue. U.S. chemical industry capital spending increased by 6.0% in 2017 and should average 6.3% in 2018 and 6.8% in 2019 because many projects have been stretched out. Growth should increase in the 2020–2022 period, averaging 7% per year. By 2022, U.S. capital spending by the chemical industry will reach $48 billion — nearly two-and-a-half times the level of spending at the start of this prolonged cycle in 2010.
Access to plentiful and affordable natural gas supplies is allowing the United States to capture an increasing share of global chemical industry investment. This trend will continue as the United States remains the destination for chemical industry investment.
Outlays for bulk petrochemical and organic intermediates along with plastic resins will dominate investments. Spending for buildings and structures present strong opportunities during this period, beginning with expenditures for site preparation and utilities and afterwards for building and installation. However, specifying and procuring major process equipment for many projects already has taken place.
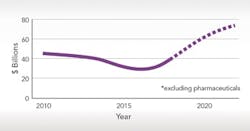
Figure 6. The U.S. trade surplus in chemicals should continue to grow.
Trade
The U.S. chemical industry posted a $32 billion trade surplus in chemicals (excluding pharmaceuticals) in 2017; exports (on a dollar basis) rose 4.9% to $127 billion while imports increased 2.8% to $96 billion. Some sectors of chemicals trade where the U.S. has a competitive advantage are expanding on a volume basis but, with low oil prices pulling down sales figures, growing exports aren’t readily apparent in the topline (including pharmaceuticals) trade numbers. Two-way trade between the U.S. and its foreign partners reached $223 billion in 2017, a 4.0% expansion from 2016. Total trade will rise steadily through 2022. The high U.S. dollar will continue to pose a challenge at least over the next year by making exports relatively more expensive, eroding the competitiveness of American firms operating in the global market. However, broad and sustainable improvements in the economies of many trading partners have considerably brightened the outlook for U.S. chemicals export demand.
Overall, the outlook for U.S. chemicals exports is positive. Following three years of contraction, U.S. chemical exports rose 4.9% in 2017 and will continue to expand through 2022. Peak growth will occur in 2019, reflecting a moderation in the impact of the high dollar as well as the startup of new industry investment. Assuming no major disruptions to the trade scenario occur, by 2022 the industry should boast a $73 billion trade surplus in chemicals (excluding pharmaceuticals), driven by a $64 billion trade surplus in basic chemicals.
Positive Prospects
At the end of 2017, the American chemical industry largely had recovered from the effects of the hurricanes. Now, the stage is set for significant growth in output as new production capacity comes online and demand firms up in key end-use markets in the U.S. and abroad. Inventory imbalances are easing, thus new production rather than stock drawdowns will meet the increasing demand. Significant additions to capacity will result in above-trend growth in basic chemicals through 2022 in addition to solid output growth in other segments.
The United States continues to enjoy a competitive advantage from shale gas and abundant new supplies of natural gas liquids that is spurring substantial capital spending: nearly 65% of the chemical industry investment announced since 2010 has been completed or is currently under construction. As new production expands to meet growing global demand, employment in the chemical industry will accelerate further. The industry should continue adding high-paying jobs through the end of the decade. U.S. chemical exports (excluding pharmaceuticals) are growing and, as external demand becomes more robust, this trend will take off.
MARTHA GILCHRIST MOORE is senior director, policy analysis and economics, for the American Chemistry Council, Washington, D.C. Email her at [email protected].
