Quality can be defined as the degree or extent of excellence. Everyone wants to improve process quality. However, it can be difficult to quantify and evaluate a product's quality.
The key parameters commonly used to evaluate instrument quality are device reliability and repeatability. Tough questions remain, however, incuding:
How do you quantify the value of improved reliability and repeatability?
Which specifications are critical to instrument reliability and repeatability?
Are specifications an "apples-to-apples" comparison across suppliers?
How do suppliers prove their specifications?
What programs are available to continuously improve specifications?
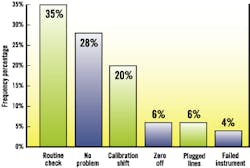
Typical Work Orders for Pressure Transmitters1
Quantifying quality's value
From a broad perspective, quality improvements impact plant profitability through increased production and reduced cost of goods sold. More specifically, improved reliability translates into:
Increased production. Reducing the risk of costly unscheduled shutdowns results in improved availability (hours available to produce divided by total hours available). Improved device repeatability translates into increased production and/or reduced cost of goods sold through better measurements.
Better device repeatability provides users with the opportunity ," at no increased environmental or safety risk ," to reduce raw material costs for control applications, improve billing accuracy for custody transfer applications, or improve decision-making for monitoring applications. Therefore, one dollar of reduced flow uncertainty yields one dollar of opportunity to reduce operating expenses.
Reduced cost of goods sold. Costs are reduced through the prevention or elimination of unnecessary work. In the case of instrumentation, unnecessary work equates to work orders and trips to the field. The figure provides an industry benchmark for pressure transmitter work orders. This graph illustrates the various opportunities to reduce the time and cost of preventive maintenance programs. The obvious benefit of improved product quality is to reduce product failures, calibration shifts, plugged lines, etc., which account for roughly one-third of work orders. However the larger opportunity, which represents roughly two-thirds of work orders, is to reduce the frequency or need for quality validation from routine checks or "no problem found." This is accomplished by documenting product quality improvements and subsequently challenging the existing practices based upon earlier product quality standards.
Evaluating reliability
The two parameters central to instrumentation reliability are quality control and product robustness. Quality control is a measure of product performance under normal operating conditions, while product robustness is a measure of device reliability under abnormal conditions. Many users attempt to compare and quantify robustness and quality control for different manufacturers by evaluating designs and the vendors' professed commitment to concepts such as continuous improvement, International Standards Organization (ISO) 9000, Six-Sigma quality, total quality management (TQM) and other quality intiatives. Unfortunately, such comparisons are not typically "apples to apples," so they are not always useful for decision-making.
Quality control. Perhaps a better tool for evaluating device and manufacturer quality is mean-time-between-failure (MTBF) data. MTBF is defined as a measure of random constant failures that are not reducible through material selection or routine maintenance and affect only the wearout failure modes. MTBF is not a measure of how long a device will function under field conditions.
Although MTBF is a quantitative benchmark for evaluating device and manufacturer quality, the data are difficult to compare because different suppliers use varying approaches to determine MTBF.
MTBF example for
a pressure transmitter:
Observed MTBF = 1200 years, predicted MTBF = 285 years and demonstrated MTBF = 175 years at a 95 percent confidence level. At a 50 percent confidence level for that same device, the demonstrated MTBF increases to more than 368 years.
Examples include:
Observed MTBF based on user-reported failures. Because most users do not report all failed transmitters, MTBF is inflated, and suppliers with better customer service and communications are actually penalized.
Predictive MTBF is a component analysis provided by suppliers and usually validated by independent third parties such as Factory Mutual (FM) and/or TV. The analyses are performed a laboratory environment. Based on the author's experience, "real-world" installed reliability always is much worse for field devices such as transmitters. Therefore, users can evaluate the real-world reliability and life-cycle-cost impact of specific technology and user practice alternatives only by quantifying installed reliability.
Demonstrated MTBF is probably the most useful MTBF method for predicting installed reliability. It is based on highly-accelerated life-cycle testing (HALT).2 However, this approach requires the destructive testing of many transmitters and is prohibitively expensive for all but the highest-volume suppliers.
It is important to verify that the MTBF numbers are measured consistently and the specifications are given at the same confidence level. As the confidence level increases, the MTBF number decreases.
Product robustness. If MTBF is a measure of random constant failures, product robustness is a measure of how a device performs under unplanned or abnormal events. Often, product robustness is used to describe the installed reliability of an instrument.
Examples of product robustness criteria for a pressure transmitter can include:
The ability to protect against process corrosion and hydrogen permeation.
The ability to handle rapid and severe over-pressure resulting from the "water-hammer" effect or improper equalizing line pressure after calibration.
The ability to protect electronics from humidity and condensation.
The necessary corrosion resistance within the field terminal electronics to protect against improper housing cover sealing of during installation.
Adequate electronics protection to prevent electrostatic (ESD) damage during handling and installation .
Adequate physical shock protection to protect against improper device handling or dropping.
One potential predictor of installed reliability is experience. In general, the fifth release of a device will be more reliable than the first. The question to the supplier, therefore, becomes: "How many thousands of devices, or devices of similar design, have been installed in similar applications?" The supplier also should be willing to provide references.
Useful references for your assessment should be, in part, based on a history of continuous improvements for product design enhancements. Minimum components of continuous-improvement programs include:
A feedback loop for communication on product reliability, including application assistance and failure analysis detection.
Documentation of any changes that affect form, fit, function, materials or performance specifications and approvals.
Design and manufacturing testing to verify any changes that affect form, fit, function, materials or significant performance criteria.
Validation of 100 percent of product to published performance specifications. Maintain, track and review data for 100 percent of units.
Random audit testing of a product from all manufacturing locations ," i.e., product inspection, performance testing, etc.
The request to the supplier, therefore, becomes: "Please provide a product quality review outlining and proving your specifications."
"Good, better, best" compares the transmitter total performance (includes reference accuracy, static pressure, temperature and drift) of one 0.1 percent and two 0.075 percent reference accuracy devices.
Repeatability and specs
How can the user quantify the impact of "real-world" sources of error? For any measurement, the accuracy and repeatability in a real-world application will usually be lower than in the laboratory. Consider, for example, a differential pressure (DP) transmitter with 0.1 percent reference accuracy installed on an orifice plate. Will the complete measurement system provide 0.1 percent, 1 percent or 10 percent flow repeatability?
The first step is to identify the factors that will cause a transmitter to be less accurate and less repeatable outside of a laboratory. Using the example of a DP flowmeter, "real-world" effects can include:
Expected ambient temperature variation.
Maximum static line pressure.
Process fluid pressure and temperature variation for gas or steam.
Line temperature variation (for liquids).
Flow turndown.
Transmitter drift over time.
The next step is to quantify the impact of these real-world conditions for the given application and transmitter of interest. For DP flow applications, reputable instrument suppliers publish specifications that allow the user to calculate and predict the impact of these and other "real-world" effects on installed flow accuracy and repeatability.
The results under "typical" installed conditions are shown in the table. Although these errors might seem small at 100 percent flow, the errors are magnified at lower flow rates for two reasons.
First, any error remains fixed over the entire transmitter range. For example, consider a 1-mile per hour (mph) error in your speedometer. At 100 mph, this is a 1 percent error; however, at 10 mph, it becomes a 10 percent error.
Second, for DP flow applications, flow is equal to the square root of DP, meaning flow errors increase exponentially at higher turndowns. For example, 1/2 flow equals 1/4 DP, 1/4 flow equals 1/16 DP, etc. Many suppliers offer software tools that allow users to quantify the installed repeatability for specific transmitters in specific, user-defined application conditions.3
Two conclusions can be made from the table:
Reference (laboratory) accuracy is a trivial component of total transmitter installed error.
Two DP transmitters with identical 0.075 percent "reference accuracies" can provide dramatically different installed accuracies. CP
Wickberg is manager of pressure applications for Rosemount Inc., a division of Emerson Process Management, Chanhassen, Minn. Contact him at [email protected].


