Energy Saver: Benchmark Energy Efficiency Using R-Curve Method

Earlier this year, I discussed a simple methodology to evaluate the efficiency and cost of your imported power. In this column, I will demonstrate a methodology, the R-curve analysis, to evaluate, benchmark and design heat and power systems and identify potential improvements.
The R-curve, in the context of chemical engineering and process optimization, refers to a concept used to determine the maximum shaft work — or energy transfer— required in a chemical plant. It is used to analyze the performance of a system that involves multiple interconnected components, such as pumps, compressors, boilers, gas turbines, steam turbines and other equipment. This is then compared to the need for a hot utility, such as steam, to heat process streams.
The R-curve is a graphical representation of the relationship between the rate of energy transfer, or shaft work, and the heat required for a process stream.
A chemical plant will need shaft power provided by electricity (electrical motors) or steam turbines and gas turbines. The same steam is also used for reboilers, strippers, heating process streams and more. Based on the ratio between the two needs for steam, shaft power and heating, you can calculate the highest efficiency for heat and power possible for your plant. For this calculation, you can develop the R-curve.
The R-curve is a graphical representation of the relationship between the rate of energy transfer, or shaft work, and the heat required for a process stream. It helps engineers and operators identify the optimal operating point where the system can achieve the highest energy transfer efficiency. It also is used for designing a utility system and to identify the most efficient operation. Typically, the R-curve is determined by detailed process simulation of the utility system. In this simulation, all boilers, steam headers, gas turbines, steam turbines and other equipment like pumps and deaerators are considered.
Here's how the R-curve works: The energy transfer rate (shaft work) is the mechanical work done by a device like a pump, compressor or turbine. Usually, it is measured in units such as kilowatts (kW) or horsepower (HP). The energy needs from steam, often used for reboilers, stream heaters, stripping steam, vacuum ejectors and steam tracing, is typically measured in MMBTU/h or GCal/h. The ratio of these two energies used is shaft power divided by steam energy use (converting the numbers to identical units); it is generally plotted on the horizontal axis of the R-curve. The vertical axis displays the cycle efficiency of shaft work generation. Figure 1 is an example of an R-curve.
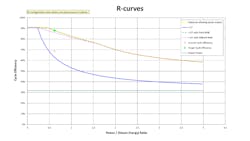
1. If the ratio of shaft work and (steam) heat is very small, the plant needs very little amount of shaft work compared to steam uses. This means all power can be produced by efficient back-pressure steam turbines, and the cycle efficiency is over 80%.
2. If the ratio of shaft work is much higher than the required (steam) heat, the plant needs a lot of shaft work. This can be delivered by imported power (green dotted line) and or condensing turbines (blue line), and the maximum plant efficiency is lower than 80%, according to the R-curve.
3. In Figure 1, the red cross shows the actual cycle efficiency of 69% for a chemical plant (an oil refinery in this case), while the R-curve shows the maximum obtainable efficiency (benchmark) of 88%.
4. In addition, the dotted green line and pink line show the maximum obtainable efficiency using a gas turbine power generator, one with gas co-firing on the steam generator to produce more steam and one case with no gas co-firing on the steam generator. The co-firing option is, in this case, more efficient in the power-to-heat ratio ranging from 0.3 to 1.1.
When designing a utility system, engineers can use the R-curve to adjust the components’ sizes, capacities and operating conditions to achieve the desired optimal operating point. By carefully selecting the steam pressures, temperatures and equipment that can efficiently generate steam from waste heat, the maximum shaft work production can be achieved while considering factors like energy efficiency and reliability.
In summary, the R-curve is a tool used in chemical engineering and process optimization to determine the optimal operating point of a utility system that involves energy transfer devices like pumps, compressors and turbines. By understanding this curve, engineers can benchmark or design and operate chemical plants more efficiently, maximizing shaft work production while considering factors such as energy consumption and system reliability.
About the Author

Michiel Spoor, Energy Saver columnist
Energy Saver columnist
Michiel Spoor has over 28 years of energy experience, working worldwide as a leader in oil and gas consulting. He has a master’s degree in Chemical Process Technology from the Delft University of Technology in The Netherlands.
His passion is to shape the future of energy transition, renewables, global carbon emission reduction and energy efficiency. He has had diverse roles in engineering and consulting. He started his career as a process design engineer at Badger BV in The Hague where he brought plants from conceptual design, through process simulation, equipment designs all the way to commissioning and start-up.
As a consultant Michiel specializes in energy management and energy transition and has held senior positions in various companies like KBC, Accenture and KBR. Currently Michiel works as a Principal Consultant Energy with KBC Advanced Technology in Houston, Texas. He has worked on six continents on various projects and positions in oil refining, petrochemicals, fertilizers, LNG and renewables.
Michiel has authored and contributed to numerous papers and conferences on the topics of refinery energy efficiency and refinery carbon management. He is internationally recognized as an authority on this subject.