Quantafuel's Digital Evolution: Advancing Sustainability with Data Integration and Traceability
There’s no indication that plastics recycling is slowing down despite calls to halt plastics production altogether during talks over a global plastics treaty.
Recent announcements from major petrochemical companies, like Shell Chemicals and Braskem, underscore sustained investment in the sector.
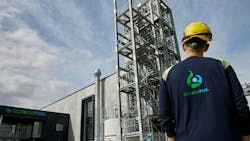
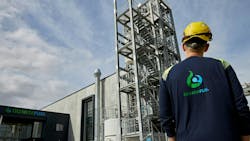
But the landscape isn't solely dominated by established chemical giants. Emerging players like Quantafuel, based in Oslo, Norway, are making significant strides. Founded in 2015, Quantafuel specializes in converting post-consumer plastic waste into valuable feedstocks for chemical products.
The company’s operations include a chemical recycling facility in Skive, Denmark, and a plastic sorting plant in Esbjerg. With upcoming expansion plans in the UK and several other locations, Quantafuel is rapidly scaling its global production capacity.
Central to the company’s strategy is the integration of digital technologies into its processes to ensure traceability — a vital aspect in verifying sustainable materials for customers — and to drive efficiency in an increasingly competitive market.
In a noteworthy development, on Feb. 7, Viridor, a UK-based plastics recycling and waste-to-energy company, finalized its acquisition of Quantafuel. This acquisition not only signifies a strategic move for both organizations but also includes the transfer of certain digital capabilities from Quantafuel to its new parent company.
This includes ongoing digital initiatives at a major sorting plant in Avonmouth, Bristol, UK, says Thomas Lier-Nilsen, Quantafuel’s operations manager.
On the same day the acquisition was completed, Lier-Nilsen and Petteri Vainikka, chief marketing officer for Cognite — a software provider collaborating with Quantafuel — sat down with Chemical Processing to discuss the company's digitalization efforts. The following is an edited version of that conversation.
Can you tell me a little bit about the digitalization project you’re working on?
TLN: Quantafuel is relatively small company, with about 100 people, including 50 in our Oslo headquarters and the other half in our chemical-sorting plant in Skive, Denmark. In 2021, like many other plants, we have a SCADA system and an MES system, and the operators used this to operate the plant. But we didn't really use any of that operational data throughout the company. That was how we started making all this data available for the rest of the company through a digital platform, and we ended up with Cognite. From there, we entered phase one of our digitalization project, getting all of our SCADA data, contextualizing it into a platform, and then we could start to use it in either Power BI or Python or Grafana.
Tell me about the “bill of sustainability” that Quantafuel has developed. What is it and how does it work?
TLN: Our feedstock suppliers, whether we get it from municipalities or suppliers, want to know what's happening to their plastic waste — how it’s recycled, the recycling grade and where it ends up. Going forward, we might need to compete for this plastic, good traceability will be a competitive advantage. Once we had the SCADA systems and MES all connected in Cognite Data Fusion, we were able to create a bill of sustainability similar to a bill of lading document that you might receive as a truck driver. It allowed us to provide a good, nearly automatic report back to customers or suppliers. We weren’t able to do that earlier.
What types of data are you collecting in your plant?
TLN: The Skive plant is a chemical plant, a continuous processing plant, similar to oil and gas. So, we have a lot of time series data — we have a lot of valves opening and closing, and we have a lot of motors and pumps starting and stopping. To live stream all that data, that was really a challenge. But the good thing for us in that first plant is it was basically only one SCADA system, and that obviously makes it easier. I guess a lot of legacy plants would struggle a lot more than we did.
In phase two of the project, we started to import MES data, so that's slightly different data. Examples include the types of plastic and how much and when did you put it into the plant. And, how much oil we offloaded or unloaded to the trucks, so that's more event-type of data. But putting it together was really useful for us seeing the different performance (variables) in the operation of the plant.
And all this is important for your customers as well, right? Because they want to know whether it's really sustainable?
TLN: Going forward with the regulations we see coming, that will be key. So, I think we will be very good at it — upstream or downstream to tell where it came from and downstream where it will go or the other way around. So that is obviously key. For the, chemical recycling plant, where we produce oil. As long as we're within specification and on this large tank of oil, we can say, it's 30% from this supplier and 50% from this other. But even for the plastic sorting plants, the mechanical plants, I think this traceability is much more important or equally important but more difficult to do, I would say that's our next big use case.
What were some of the challenges you faced with the implementation?
TLN: We had a fairly mature, well-engineered tagging system in the plant. With Cognite, it wasn’t so difficult to get the data (into the platform), get it contextualized and get all the operational data streaming in. But in the beginning, while it was obvious to us that this is smart, maybe we could have had more focus on explaining the adoption part to the site team. We do a lot better now, but that was a challenge in the beginning, maybe, because we were so happy about the solutions, and we didn't really pay enough attention to the site team. So now that's changed, and we have included them a lot more in the development.
PV: Oftentimes, the individual parts of the process, the individual teams, have their own solutions, and they're typically quite accustomed to working with the tools they have. The more challenging part than building the business case is building the end-to-end visibility. That requires a unified view across all of the steps of the process and then bringing together the different data from the different systems across the whole value chain. And that again is something in the bill of sustainability, for example, when you have to report on the end to end, you need that view. But conventionally, if you just look at a plant that has operations and different teams and different segments, they're used to optimizing on their own; it's kind of sub-optimization of the whole process. Teams can feel like they are doing really well at their individual sub-optimization task and typically they are. But building that awareness and understanding of the whole value chain that we need or the whole process that we need to optimize is not always straightforward. Achieving that comes from being able to give others visibility into what the impact of your optimization is on something else.
Where are you at right now then with your current project?
TLN: For the first plant, we have completed the first three phases. So, we're fairly well off on that plant, and as an example, we were able to easily perform scope 1 and 2 CO2 calculations, which probably is challenging for some, I would assume. And now we're in, , a continuous operation when it comes to this data platform. We have a sort of a decision board with the operations team and our developers, and we constantly work on use cases and implement them.
PV: And being able to deliver scope one and scope two on emissions is not a cake walk for most. So that will take some time. But with scope three coming into play as well, I think the importance of having the data foundation and being able to pull everything together and provide that unified view across the whole value chain will become a license to operate for more and more.
So when you're talking about tracking your scope one and two, can you tell me specifically what you're tracking there?
TLN: We have analyzers on all the major CO2 emission points, so we know all the emissions and their composition. So, we continuously measure all of our emissions. Then, you need the composition of the electricity and the grid gas. That was easily done in the Cognite Data Fusion (CDF) tool. It’s fairly traceable and visible in a time-series data format.
We can go into the “operating room” and look at the trends. From there, we can export, for example, these three analyzers, get it on an Excel spreadsheet and look at the last three months. All of that data is continuously streaming up to this digital platform that you can access from the office, at home or wherever you are. In this platform, you select which plant you want to see, and then there is a breakdown of all the assets in that plant.
And luckily for us, that harmonizes quite well with the tagging structure. The time-series data that we are streaming will be then automatically connected based on rules and AI and magic, at some point. That sort of channel of live operational data just streams in, and we can browse them by tag. Then, we can say, “Give me these three analyzers and the gas and the electricity consumption” and look at the graphs. And then, we can see, for example, that the composition of the electricity is fairly stable.
You can then do calculations to get one final curve, which is your CO2 emissions.
What would you say have been the primary advantages or benefits since you deployed the system? Has it helped your operations perform more efficiently?
TLN: We had actually struggled to say, more or less, in real time what our yield, throughput performance and uptime was. Many operators collected some numbers and made their own Excel performance sheets. They were the same thing but different views across the organization. I think the biggest value was that we all had to sit down and agree what's actually the yield calculation. So, it was just forcing everyone to agree on those KPIs, how they are calculated and which KPIs we work towards and then presenting them in a dashboard. That was sort of the final outcome I would say of phase one.
So you had mentioned scope 3 emissions as well. Are you currently tracking that or do you have plans to?
TLN: For sure, we have plans, but we don't track scope three now in CDF, but I think that would be the place where we will do that calculation, as well. I'm pretty confident that getting some data upstream and downstream, we will still do the scope 3 calculations, I would assume, in CDF, but we haven't programmed anything yet.
So what’s next in your digitalization journey?
TLN: We are reusing all that we have done on that Skive plant and implementing it in the next plant, which is in Esbjerg, Denmark. There, we will do the same things: Establish the data platform, stream all the data, build assets in CDF and start to do performance tracking as we did in Skive. But the really big challenge there is the traceability. We need to track all these plastic bales. I think we will land on some RFID tracking around the plant, so we need better control of the feedstock in the products. Getting all the process data, the live stream and storing and tracking of all this plastic through this plant will likely be done in CDF, with slightly different modeling. That’s currently ongoing now.
About the Author
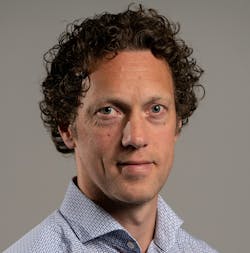
Jonathan Katz
Executive Editor
Jonathan Katz, executive editor, brings nearly two decades of experience as a B2B journalist to Chemical Processing magazine. He has expertise on a wide range of industrial topics. Jon previously served as the managing editor for IndustryWeek magazine and, most recently, as a freelance writer specializing in content marketing for the manufacturing sector.
His knowledge areas include industrial safety, environmental compliance/sustainability, lean manufacturing/continuous improvement, Industry 4.0/automation and many other topics of interest to the Chemical Processing audience.
When he’s not working, Jon enjoys fishing, hiking and music, including a small but growing vinyl collection.
Jon resides in the Cleveland, Ohio, area.


