1660320814637 Fig 4bheatexbad

Equipment Maintenance: Thermal Imaging Changes the Picture

May 7, 2009
Pharmaceutical plant benefits by taking a different look at equipment.
Another Article on Thermal Imaging You May Like:
As a contract manufacturer of pharmaceuticals, CMC icos Biologics, Inc., Bothwell, Wash., must comply with current Good Manufacturing Practice established by the U.S. Food and Drug Administration. As the company’s manager of engineering operations, I use a variety of monitoring strategies to keep us in compliance. Most recently, I have added thermal imaging to the mix, for semi-annual preventive maintenance inspections and troubleshooting equipment issues and process problems. Until 2008 an outside contractor performed all our thermal scans, which provided baselines for subsequent monitoring of critical equipment. That year we brought thermography in house. We acquired a Fluke Ti10 Thermal Imager. This instrument produces infrared (IR) images that reveal the surface temperature of objects and links each image to a regular (full visible light) image.
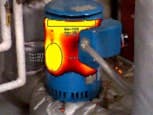
Figure 1. Alarm mode image:
Combining regular and thermal
images pinpoints motor areas
of concern.
This allows me to place a visible light picture as a frame of reference around a thermal image. Or I can blend the visible and IR image in any ratio to create a single image with enhanced details. Or, my favorite, I can create an “alarm mode” image, in which only temperatures that fall above, below or within a specified range appear in IR while the rest of the scene is full visible light. It’s powerful to be able to see the two images together. The motor image in Figure 1 illustrates the alarm or limit function. I use this a lot to isolate the exact location of hot areas. Software that comes with the instrument enables me to adjust alarms, add more temperature data and zero in on the heat location. Having a diagnostic tool that can get rid of all non-critical values makes my job easier. Wide ApplicabilityI’ve already used the thermal imager on a broad range of equipment: Motors. Efficiently operating motors have a normal thermal pattern. My background in electrical and mechanical systems means I’m familiar with that pattern and helps me both identify and diagnose abnormal heat signatures. In general, the more familiarity the thermographer has with the equipment being inspected, the more effective the diagnosis. For example, in Figure 1, it was clear to me that the problem was a bad winding and not something else, e.g., inadequate airflow, unbalanced voltage, an overload, a failing bearing, insulation breakdown or shaft misalignment.
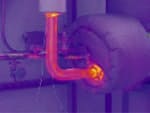
Figure 2. Steam trap operation:
is operating correctly but trap  

Scanning shows trap on left
on right has failed.
Electrical Panels. When I’m scanning these panels I’m usually looking for signs of loose or corroded connections that increase resistance at the connection and show up as hot spots before failure occurs. My team and I scan all electrical service components at the plant, including main distribution elements such as switchgear, transformers and transfer switches. This has enabled us to detect installation issues as well as operating problems. For instance, we found an abnormal temperature increase in a breaker just after it was installed. Physical investigation discovered a loose leg. We even scan oil-cooled transformers that are maintained by a contractor. I keep baseline images and monitor semi-annually just in case. I look for significant hotspots toward the ends of the cooling fins. Steam traps. We scan our steam traps at least semi-annually. A well-functioning trap should have a high inlet temperature and a lower outlet temperature (Figure 2 at left — in this case, there’s a difference of 70°F). In Figure 2 at right the trap has failed open. There’s only a 20°F difference between the inlet and the outlet. A trap as large as this one holds a lot of heat and should show a significant difference. Cold room. Here, product is stored near freezing but must not freeze. Sensors mounted throughout the room monitor it but we use the thermal imager, too. We were concerned about the floor as well as the product freezing, so we went through with the camera to get a complete picture. The thermal view was very useful for quality control and for ongoing evaluation. The thermals also served as a baseline on how the room was operating. Hot room. We use the thermal imager in our server room to compare ambient air temperature against a wall-mounted sensor, as a quality control check.
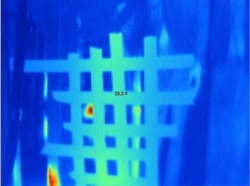
Figure 3. Coping with stainless steel: Using a lattice
of tape on a stainless steel tank enables inspection
of its insulation.
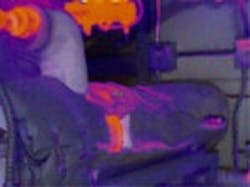
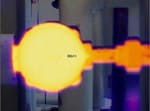
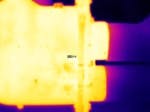
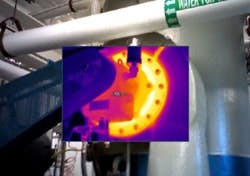
Tanks. Our tanks are stainless steel, which makes monitoring their insulation difficult. Of the three kinds of energy that can be emitted from an object — reflected, transmitted and emitted — only emitted IR energy indicates the object’s surface temperature. Energy reflected from a shiny stainless steel tank recorded by a thermal imager doesn’t represent the true surface temperature. To compensate, we place paper tape in a lattice pattern on tanks to monitor soundness of interior insulation. The tape quickly reaches the temperature of the surface beneath, allowing us then to make a valid reading. Figure 3 shows an example of the lattice pattern. In this case we were inspecting for suspected bad insulation in the steam jacket. This image indicated the jacket was warm, not overly hot, disproving our theory. Refrigeration units. We have multiple refrigerators, freezers and stability chambers (very precise temperature/humidity control devices). I need to verify their internal controls. Stability chambers in particular only should fluctuate within ½°C. We were having temperature control issues with a stability chamber. We inspected it and noticed the door was misaligned. I got the thermal imager, scanned the door, and saw the seam was cool instead of hot — it was leaking cold air. We now will scan all refrigeration units semi-annually to check for seal failures to preempt temperature control issues. Heat exchangers. I regularly inspect the several heat exchangers on site with the thermal imager to ensure they’re operating efficiently and their insulation is sound. Before having the imager in house, I had to guess whether the exchangers needed repair or wait until problems arose. Figure 4 illustrates both a well-insulated unit (left) and a unit with insulation problems. The left image shows hot going in and cold coming out, with very little leakage. I checked temperatures at the joint at the top left and to the heat exchanger at right, and I scanned the exchanger’s insulation.

 Fig.4. Heat Exchanger Insights
 The heat exchanger on the left
has good insulation while the
one on the right suffers from
insulation problems
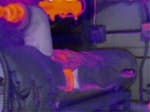
The right image indicates significant heat leakage through the insulation. Just to be sure I checked that I wasn’t seeing heat reflection of any sort. This kind of temperature pattern tells me I have severe insulation issues. This image convinced me to add all the heat exchangers to my semi-annual inspection route. Chillers. As the saying goes, chillers have both a hot end and a cold end. On the hot end abnormally superheated spots might indicate a bearing failure. On the cold end subfreezing temperatures or hot spots might point to bearing failure or premature compressor wear. Compressors. We have some very large, very expensive turbine compressors. These large belt-driven units handle vapor compression in the water-for-injection unit. They literally “wring the water out.” Not too long ago I spent $14,000 to repair a spare compressor. Figure 5 shows a great baseline image of the main turbine compressor, a $20,000 unit. You can see the belt drive at left, the turbine in the middle with bearings and fluid, and the head plate where it bolts to the still. The unit is turning very fast. From this vantage point (the drive end), we would look for temperature variations compared to this baseline. These possibly would indicate bearing failure at the shaft or clogged oil ports, which manifest as hotspots near the bearings. Given the cost of this unit we consider semi-annual thermal inspections an essential means for preventing premature failures.

Figure 5. Well-operating compressor: This image will
serve as the baseline for semi-annual scans of an
expensive belt-driven turbine compressor
Looking Ahead Starting with the contractor’s baselines, I’m building a very thorough regular thermal inspection program. I’m finding more and more inspection targets all the time. When my monitoring program is completely implemented, members of my team (who have established skill sets in electrical, electronics, mechanics and other specialties) will be able to use the imager, as well, traversing pre-set inspection routes with descriptions of exactly where to stop to record thermal data. I’ll then download their images to my computer and use the software to analyze them. Jeff Fleming is manager engineering operations support for CMC icos Biologics, Inc., Bothell, WA. E-mail at[email protected].

Sponsored Recommendations

Keys to Improving Safety in Chemical Processes (PDF)

Many facilities handle dangerous processes and products on a daily basis. Keeping everything under control demands well-trained people working with the best equipment.

Get Hands-On Training in Emerson's Interactive Plant Environment

Enhance the training experience and increase retention by training hands-on in Emerson's Interactive Plant Environment. Build skills here so you have them where and when it matters...

Rosemount™ 625IR Fixed Gas Detector (Video)

See how Rosemount™ 625IR Fixed Gas Detector helps keep workers safe with ultra-fast response times to detect hydrocarbon gases before they can create dangerous situations.

Micro Motion 4700 Coriolis Configurable Inputs and Outputs Transmitter

The Micro Motion 4700 Coriolis Transmitter offers a compact C1D1 (Zone 1) housing. Bluetooth and Smart Meter Verification are available.