Operational excellence (OE) is becoming the focus for large chemical, petrochemical and refining companies. Such initiatives are aimed at building and sustaining efficient, safe and effective operations. Many firms adopt these programs intending to improve their health, safety, environmental and quality performance. Most OE initiatives focus on defining and implementing best practices and standardizing these methods across a facility or an enterprise. The output is measured in terms of commercial success, productivity, safety, sustainability and more. Achieving consistent performance improvement is the goal. To do this, operators must identify and manage any and all risks that threaten success.
The success of any OE initiative depends upon three key elements:
People (beliefs, values, and capabilities). Personnel must know what they should do, understand why, and be capable of doing it.
Processes (how things should be done). Organizations need a defined and properly communicated approach that controls output and ensures consistency in practice.
Technology/tools. People and organizations require underpinning support for delivering efficiency, consistency and process control.
[callToAction ]
One of the challenges to achieving OE in a facility can be the organization itself. Most companies understand the benefits of integrated teams but tend to behave as though they are composed of silos, e.g., maintenance, engineering, asset integrity, reliability, operations and health/safety/environmental. This is understandable because each functional discipline usually uses in its own distinct language and methodologies. Yet, these silos can create difficulties and may adversely affect the objective of optimal operations. For instance, they may rely on information systems specific to their discipline, resulting in data silos that the rest of the organization can’t easily access.
This is a major challenge to OE where achieving efficient, safe and effective operations depends upon critical ad hoc decisions that impact a range of disciplines. When functional/discipline priorities conflict, cross-functional tension influences these decisions. Consider, for example, inspection, preventative maintenance and repair that drive the majority of daily activities. These efforts typically are carried out in a live plant with inherent hazards and ongoing operational activities such as starting up or shutting down equipment, isolating energy sources, changing out filters, pig receiving, operator rounds, etc. Other departments also might be active in the vicinity, e.g., working on adjacent units, small construction projects, temporary location of equipment, crane operations, etc. Constraints on these activities — such as safety considerations, budget, work clashes and resource limitations — are sure to arise. In other words, operators seldom can do all they want when they want. Priorities must be established and compromises made; sometimes a decision will mean deferred or canceled work. This is merely one example of how cross-functional conflict occurs in a plant and leaves frontline operations responsible for deciding priorities and agreeing to a plan of work.
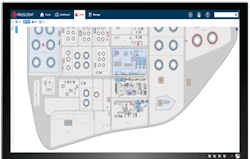
Figure 1. Hazardous work activites underway and impaired process safety barriers are apparent.
Many other examples come to mind: The integrity group must check wall thicknesses on inlet piping but the pipe insulators who must remove the lagging material are tied up on another project. Process safety is pushing for repairs to an underperforming deluge system but the high cost of transporting spares by air means that, unless the budget is released, they would have to travel by sea and wouldn’t arrive for three more weeks. Maintenance wants to carry out preventative maintenance work on a compressor but operations, which already is behind on meeting monthly production targets, doesn’t want to take the unit offline.
Integrated planning should help minimize clashes but often the pertinent criteria aren’t available when plans are set. For OE to be effective, operators must optimize their plans, ensuring they’ve identified the impact on risk of any activity scheduling. This is easier said than done because operators can’t simplify and communicate the components of risk to an extent where people other than the process safety experts can easily assess them.
Even process safety lacks models that can effectively evaluate risk in a dynamic mode with multiple components. Instead, most risk-models based on process hazard assessments, bow ties and layer-of-protection analyses are scenario-based and are more suited to design than the reality of day-to-day operations.
The Reality
Multiple activities and barrier status together impact the risk of major accidents. While until now frontline operations may have “sensed” the risk, they haven’t had the tools they need or easily accessible information to help them judge their real level of risk. As a result, many decisions are based on gut instinct rather than on data and a structured approach.
Plants today typically rely on multiple barriers to prevent a major event from occurring, with additional barriers to mitigate the consequences and limit escalation should it occur. To accurately judge the current overall level of risk, operators must understand the status of their fundamental barriers.
Operators have a lot of information on the status of their barriers across the plant. Unfortunately, these details are locked in data silos, typically only accessible to individual disciplines. For example, information on corrosion under insulation of a particular section of piping might appear in an inspection database operated by the asset integrity group. Another database, handled by the electrical group, covers the condition of gas seals on switch boxes. Meanwhile, the instrument department tracks whether or not the relief valves on the main vessels have had calibration checks. Such information may be critical to decisions being made by operations, for example, on hot work planned that requires the temporary defeat of gas detectors but isn’t easily discovered without considerable effort.
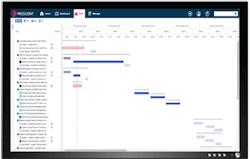
Figure 2. Display highlights if tasks planned to be done at the same time raise risk.
The individual giving permission for potentially conflicting activities to proceed must know the status of the asset’s fundamental barriers in the area where the work will take place. All too often, the default assumption is that the barrier status is good.
Investigations following major incidents often show multiple barrier failures progressively escalate risk to the point where an event occurs. However, this risk state is not identified otherwise intervention would occur. Many individual failures may not seem significant — but collectively, they can result in severe consequences.
A Fuller Picture
OE isn’t just about safety; it’s also about working efficiently and effectively. This means having excellent planning, scheduling and execution of maintenance and inspection work. The cost of maintenance and inspection is one of the highest components of the budget, so most operators are keen to ensure their workforce is highly utilized and performing the right tasks.
Historically, companies have invested heavily on improving planning and scheduling and adopting advanced techniques such as risk-based maintenance and condition monitoring to ensure the optimal use of maintenance staff time. They frequently rely on key performance indicators such as “schedule compliance” or effective “time on tools” to judge effectiveness. However, all too often these metrics indicate poor results despite sophisticated planning. One of the reasons is because the plan doesn’t contain all the elements necessary to execute work.
For example, consider the replacement of an underperforming actuated valve on a fire water main. The maintenance management system has scheduled this activity for a Thursday morning and allocated two instrument technicians for six hours. Unfortunately, this valve and actuator weigh 140 lb and are located 30-ft up on a rack. So, several sets of activities involving multiple crafts must occur in sequence. Scaffolders must erect a working platform to gain access. Instrument and electrical technicians must isolate the actuator. The fire water system must be isolated before the flange can be broken and the replacement installed. A crane is required to remove the old unit and lift in the replacement. Then the whole process must be reversed. What was originally scheduled to be a job easily completed in a shift may extend 2–3 days once all task components are taken into account. Moreover, before any work begins, a contingency plan must be initiated and agreed for the period when the fire water system isn’t functional. During that time, operations must postpone any hot work in the area.
The result is the actual work schedule can differ greatly from what was planned — causing friction among departments whose performance measures are impacted. Many craftspeople end up with low “time on tools” because they are waiting for sequenced work to be completed. Planning will receive low plan attainment and will blame maintenance, which then will point the finger at operations for not releasing equipment on time!
As with safety risk, the resulting performance comes down to decisions made during planning and work execution. The data to improve those decisions exist in the organization but aren’t easily accessible in real-time when shift-to-shift, hour-to-hour decisions must be made.
The industry has lacked systems to bring information together, including tools to manage activities and risks in an optimized way. This undoubtedly would provide organizations the visibility they need to work together more effectively.
A Better Way
OE software platforms are emerging. These dedicated systems are designed to deliver integrated OE across an organization. They enable integrating data from multiple sources and visualizing all risk and activity in real-time. All activities, including permitted and non-permitted work, the defeat of safety systems, confined space work, operations activities and more can be connected with impaired barriers. The impact of risk and activities can be understood geographically and by time (current and historical).
Zoomable displays of the plant (Figure 1) show hazardous tasks such as hot or confined space work taking place as well as impaired process safety barriers. In addition, they incorporate operations activities such as the startup of a compressor or pump. Algorithms assess and display the risk impact. The cumulative risk measures predicted and real-time degradation of fundamental barriers are based on the work schedule and ongoing impairment of specific equipment.
Operations teams can import the planned work schedule and add other criteria to make the plan more comprehensive. A display of all activities in sequence enables better decisions to ensure accurate, safe and executable work plans.
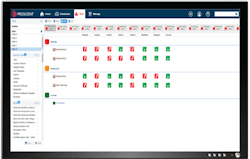
Figure 3. Screen shows cause of elevated risk level and vulnerabilities of barriers.
“Time views” (Figure 2) incorporate rules to show work clashes that are unsafe such as hot work and breaking containment in the same space at the same time. The algorithm indicates overall cumulative risk for each shift projected against the work schedule.
Dedicated risk views (Figure 3) provide a drill-down to see what is causing elevated levels of risk against fundamental barriers and also display if sequential barriers have the potential to fail. Identifying this level of vulnerability is crucial to avoiding incidents and preventing their escalation. In addition, these views can be used to simulate the repair of impaired barriers and forecast future risk reduction. Now the leadership team has real data to prioritize repair work during its planning sessions.
The emergence of OE software platforms offers an opportunity to rethink operations management. The ability to easily visualize and share information in a single place enables siloed organizations to more effectively optimize their activity plans with a common purpose of improving safety, production and quality. These tools already are helping organizations to efficiently execute their plans (see sidebar).
A lot of progress has been made in OE programs over the years to integrate and optimize processes that, in turn, energize and align people. These efforts have had success but have been limited by discrete and disconnected technologies. The emergence of a dedicated OE platform bridges that gap.
Now operators can use technology to integrate people and processes to collaborate and deliver excellent operations!
Middle East Complex Gains Major Benefits
Planning and executing the first total complex shutdown (TCS) of one of the Middle East’s largest petrochemicals and refining sites — a production facility in Saudi Arabia that processes 400,000 bbl/d of crude oil and 1.2 million t/y of ethane — posed a formidable challenge. It involved a peak of about 25,000 staff from contractors as well as 2,500 site employees.
Petrotechnics provided its software as well as a project manager and eight subject matter experts for about two months, from Oct. to Dec. 2015. With this support, risk-based activity and safety-critical tasks relating to the TCS and simultaneous operations were managed in a standardized manner, strict internal safety standards were adhered to, and a safe, standardized and consistent TCS approach was achieved. The OE software integrated with existing management and control systems to ensure uniform information for planning and execution across the enterprise.
To reduce the risk of injury to workers, 63 reusable templates were developed and approved by the operating company’s safety engineer to identify hazards of specific tasks. This led to the creation of about 42,000 job safety analyses for more than 3,200 equipment job packs. The site’s next turnaround will take advantage of this library of ready-to-use templates.
MIKE NEILL is president of Petrotechnics, North America, Houston. E-mail him at [email protected].


