Economic Outlook: American Chemical Makers Fly Higher
The output of U.S. chemical manufacturers increased in 2016 and will expand further in 2017. Growth is happening even in the face of some serious economic challenges: fiscal uncertainty, a fall-off in business investment, an ongoing balancing in the oil-and-gas sector, weakness in key export markets, a high dollar, and a major slump in the domestic and global manufacturing sector. Fortunately, compared to producers in other parts of the world, American chemical makers retain advantages, thanks to access to cheaper and more-abundant feedstock and energy. As a result, significant capital investment is occurring in chemicals manufacturing in the U.S.
In the United States, the chemical industry is benefiting from the continuing strength of two of its important end-use markets — housing and light vehicles. Good levels of activity in both markets will support economic growth this year. Business investment will recover in 2017 and the manufacturing renaissance will regain traction, contributing to the building momentum for the American chemical industry. Eventually, a sustained global expansion will result in growing trade and increased exports of American goods.
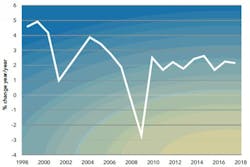
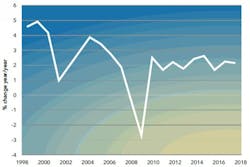
Figure 1. Growth rate should improve modestly in 2017 and remain above 2% in 2018.
However, overall growth of the U.S. gross domestic product (GDP) will rebound only slightly this year (Figure 1). The rebalancing in the oil-and-gas sector, with the concurrent decline in related investments, is a leading factor behind weak economic growth figures. Business investment and inventories typically are to blame for variations in the business cycle and, thus, we continue to monitor these parameters. Capital spending by business in the U.S. was weak during much of late-2015 and into 2016 but trends in new orders suggest a recovery of “animal spirits,” i.e., positive gut feelings, in this area. The need to enhance productivity and competitiveness will foster renewed business investment in 2017 and 2018. In the near term, consumer spending will lead U.S. economic growth; household deleveraging is largely over and consumer spending should strengthen with further improvements in the employment situation. Domestic economic growth remains below its potential because high taxes, debt, regulatory burdens and economic policy uncertainty took a toll on both business and consumer confidence.
Good Signs
The continuing rise in the Chemical Activity Barometer (CAB) of the American Chemistry Council (ACC) points to overall modest growth in the U.S. economy. The CAB is a composite index of economic indicators that track the activity of the chemical industry. (Data on the CAB appear in the Economic Snapshot in every issue of Chemical Processing.) Due to its early position in the supply chain, chemical industry activity leads that of the broader economy — thus, the CAB can portend turning points in the overall economy. Currently, the CAB is signaling continued growth in the U.S. economy through mid-2017. However, long-term growth in the economy will be muted due to factors such as demographics and policy. Tax and regulatory reform promised by the incoming Trump Administration could go far to rejuvenate U.S. economic dynamism and performance.
Light vehicles represent an important market for the chemical industry (nearly $3,500 per vehicle) and production has remained robust. U.S. light vehicle sales should stay near record levels in 2017, although down a bit from 2016 (Table 1). A robust labor market and favorable credit conditions will be offset somewhat by the dwindling of the pent-up demand that fueled sales over the past several years. That said, the odds are better that sales will beat rather than lag the forecast.
Table 1. Two key factors underpinning chemicals demand — light vehicle sales and housing starts — should remain strong.
Housing also is a large consumer of chemicals (about $15,000 per start) and the outlook is for continued progress. Inventories are low as are interest rates; employment and wage gains will lead to improved household formations, the prime long-term driver for housing. Housing starts will rise from 1.16 million in 2016 to 1.29 million in 2017 and return to the long-term underlying demand pace of 1.5 million units per year by 2020.
Outside of the U.S., world trade is expected to revive in 2017 after lagging world GDP in 2015 and 2016. Global manufacturing, which softened during 2015 and 2016, also should strengthen in 2017. We are relatively optimistic about Europe but less so about Asia and Latin America. India will continue to grow at a stronger pace than China, which is suffering from problems such as overcapacity in manufacturing. Brazil and Russia should emerge from their two-year recessions. Overall, long-term global growth potential likely won’t be reached until after 2018.
Growing Output Of Chemicals
Despite a contraction in industrial output in 2016, production of chemicals continues to rise in the U.S. Headwinds from the high dollar, weak external demand and a broad inventory correction curbed output in 2016. However, as these factors wane at the same time that production from new capacity is brought online, chemical output will accelerate in the years ahead.
Over the next several years, the renaissance in the American chemical industry will materialize because of the undeniable competitive advantage created by the economics of shale gas in the U.S. This advantage has fostered new investment and new capacity in the chemical industry that now is starting to come online. With renewed vigor in domestic end-use markets and strengthening external demand, the U.S. chemical industry is poised for growth.
Table 2. All segments should experience moderate growth over the next two years.
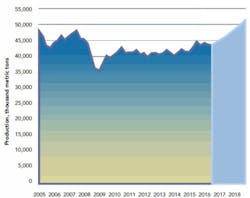
U.S. production of basic chemicals and synthetic materials (plastics and elastomers) experienced a severe downturn (and shutdown of capacity) during the last recession and had an anemic recovery. The export-led rebound weakened as Europe entered a secondary recession and emerging markets softened, leading to little growth from 2011 to 2014 (Figure 2). Decent growth resumed in 2015 — a 4.3% gain to 173 million metric tons (Table 2). However, the inventory imbalance that crept into 2016 necessitated an inventory correction that muted 2016 output — likely to only a 2% gain and a modest rise to 177 million metric tons. Starting in 2017, things get interesting as new capacity comes onstream. This year should see 5¼% growth to 186 million metric tons; 2018 should turn out even better, an 8% increase bringing production to 201 million metric tons. The strongest gains will be in bulk petrochemicals and organics followed by plastics and elastomers and then inorganic chemicals. Export markets will revive and domestic end-use markets will improve further. This is especially the case for plastic processors. For 2019 and 2020, gains should continue at about 8% per year. However, capacity utilization should slip during the next few years as additional supply comes on stream.
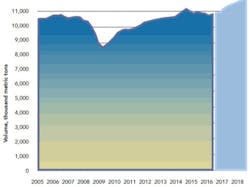
Because specialty chemicals represent a downstream market for basic chemicals, it pays to look at them separately. Robust demand from end-use markets into late-2014 drove production of specialty chemicals. A strong recovery in U.S. market volumes averaging 4.6% per year occurred since the recession (Figure 3). Business activity strengthened and broadened in 2014 (with a 3.1% gain) to a new record of 39.5 million metric tons. However, the downturn in the oil-and-gas sector and the weakness in manufacturing hobbled growth in 2015 — volume rose only 0.5% to 39.7 million metric tons. The oil-and-gas downturn continued into 2016 and the year also saw weakness in a number of specialty chemical segments — volume last year most likely dropped by 1¼% to 39.2 million metric tons. A recovery is underway and will result in a 4% gain in 2017 to 40.8 million metric tons. Aided by re-shoring and the manufacturing renaissance, market volumes should rise by 5% in 2018 to 42.6 million metric tons. Segments selling into light vehicles and the building and construction markets will do well; oilfield chemicals eventually will recover. Virtually all functional and market segments will expand. In the long-term, production will improve as the manufacturing renaissance re-engages.
Figure 2. Production should increase strongly for the next two years.
Pharmaceuticals finally are rebounding. Production decreased each year from 2012 to 2014 (-3.3%, -8.1% and -0.3%, respectively), recovered a bit (2.9%) in 2015 but fell again (-0.1%) in 2016. However, output is expected to rise by 3.1% this year and 3.5% in 2018.
An Attractive Location
The appeal of the United States for investment has changed dramatically for the better. Reflecting this, petrochemical producers have announced significant expansions of capacity in the U.S., reversing the decade-long decline in the 2000s. In fact, estimates of the gains to basic olefins capacity during the 2010s range from 35% to 40%. Through late-November 2016, companies have announced some 275 new chemical production projects with a total value exceeding $170 billion; 60% of these are foreign direct investment. The dynamics for sustained capital investment are in place and ACC continues to track the wave of new investment from shale gas.
A new capital spending cycle began in 2010 as chemical manufacturers recovered from the financial crisis and as significant expansions of existing petrochemical capacity — due to new supplies of natural gas — emerged as the driving motivation. As a result, chemical industry capital spending in the U.S. surged 21% in 2015, reaching almost $43.6 billion. During 2015, the chemical industry accounted for one-half of total construction spending by the manufacturing sector. Despite the hindrance of slow global growth, uncertainty and U.S. tax policies that discourage business investment, capital spending for American chemical manufacturing remained strong in 2016, likely increasing by 12.9%. However, this should moderate in 2017 to a 4.4% gain because many projects have been stretched out. Growth will rebound to an average of 8% per year during the 2018–2021 period. By 2021, U.S. investment by the chemical industry will reach $70 billion — nearly triple the level of spending at the start of this prolonged cycle in 2010. Capital spending for bulk petrochemicals and organic intermediates, along with investments for plastic resins, will advance from less than 29% of the total in 2010 to 52% in 2021. These sectors will benefit from the strong opportunities offered by spending for buildings and structures during this period, beginning with spending for site preparation and utilities and then with building and installation taking over.
Access to vast new supplies of natural gas has created an enormous competitive advantage for American chemical manufacturing. Plentiful and affordable natural-gas supplies are allowing the United States to capture an increasing share of global chemical industry investment. This trend will continue.
With the development of shale gas and the surge in natural gas liquids supply, the United States has moved from being a high-cost producer of key petrochemicals and resins to among the lowest-cost producers globally. This shift in competitiveness is boosting export demand and driving significant flows of new capital investment toward the United States. We anticipate that recently announced new capacity for chemicals will markedly expand production; some of those investments started coming online beginning in 2016.
Figure 3. Re-shoring and a manufacturing rebirth will help drive an upsurge.
As a result, employment in the chemical industry will rise, growing from 803,000 in 2014 to 833,000 in 2018. The industry should post a net gain of about 35,000 high-paying jobs by the end of the decade. The retiring of baby boomers will make the need to attract and retain talent paramount.
THOMAS KEVIN SWIFT, CBE, is chief economist and managing director of the American Chemistry Council, Washington, D.C. Email him at [email protected].


