Asset Management: Use Advanced Analytics To Build Better Batches

Batch chemical processes present unique data aggregation, visualization and analytics challenges that may exceed the capabilities of traditional engineering toolsets. For a start, a chronological time stamp of data won’t suffice. The relative time during a batch when a datapoint was generated is crucial. This requires the ability to identify the same point within the same phase of a batch of the same product to enable an apples-to-apples comparison and benchmarking. Complex event identification is needed to parse out the necessary data for downstream calculations, statistical and first-principles modeling, and optimization.
In addition, batch processes often store contextual information like batch quality results, along with other identifying metadata, in a manufacturing execution system or batch database. Thorough analysis requires access to all those data as well as their automatic refreshing in a single application.
Effective data visualization is a necessary precursor for performing analytics. Batch process engineers need to calculate metrics, generate statistical profiles, and create process models — with the end goal of optimizing production volumes, product quality, raw material utilization, energy consumption and other factors.
Upgrading The Toolkit
Chemical companies historically have used spreadsheets as the preliminary collection point for analyses that require data from multiple different source systems. Because simple time-series trends won’t suffice for batch comparison, a subject matter expert (SME) using a spreadsheet may spend hours manually preparing data (or data wrangling), to create even a simple batch overlay chart, and then must repeat this exercise when looking at another product or batch phase. In addition, the spreadsheet approach lacks both the live connectivity critical for long-term data analysis and the easy data visualization necessary for performing analytics.
The seemingly simple task of event identification can spiral into complex logic, one-off scenarios, and knowledge not easily transferrable across the organization.
Spreadsheet-savvy SMEs may be able to hack their way to this point in the analytics process — but what happens when it’s time to scale those efforts across different units at different sites in different geographies?
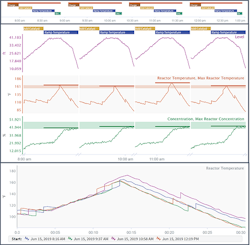
Figure 1. Capsules can provide a Gantt chart of events (top), an end-to-end view of operations (middle), and overlaid signal data during batches or particular phases (bottom).
To address these and other issues, a chemical manufacturer needs a robust analytics application that can meet scaling requirements, enhance understanding of relationships among assets, and enable consideration of differences in data sampling frequency, interpolation, and naming conventions. With such advanced analytics tools in hand, SMEs working with data from a manufacturer’s production assets can perform these activities to reduce batch cycle times and increase yield, while improving product quality and workforce efficiency.
The Essential Backbone
The path to better batch analytics begins by establishing a live connection to each of the source systems (historians, manufacturing execution systems, batch databases, laboratory information systems, etc.) containing data necessary to perform analytics across a selection of site or companywide process units. Modern cloud-based advanced analytics applications address this challenge by connecting natively to the many process data historians, asset hierarchy databases, and structured-query-language-based data sources storing quality data and contextual information on-premises, alongside cloud data sources.
Advanced analytics applications come with built-in visualization options expanding on what’s available in traditional historian trending tools. These visualization capabilities add to an SME’s ability to identify time periods of interest. Being able to slice-and-dice a data set into periods of interest enables not only novel visualization techniques (Figure 1) but also powers all downstream analytics. Some modern self-service analytics applications have adopted a new data type of the format [start time, end time, metadata] to complement the traditional [timestamp, value] pairing of sensor data.
These similar events, referred to in the use cases we’ll cover as “capsules,” enable users to calculate and compare key performance indicators during a particular operation, build variable monitoring limits, calculate golden profiles, and specify model training data. With the calculations performed, the next challenges to address are near-real-time deployment, knowledge capture, and scaling of the analytics to other batch production processes within the organization.
A live data-source connection allows SMEs to configure calculations to automatically update as new data appear in source systems, enabling continuously updating quality models, production forecasts, and maintenance projections. The browser-based nature of these tools permits companywide access to the live updating results, whether by display on a large control room monitor, email notifications behind the scenes when process triggers are exceeded, or other means.
The live data source connections that power modern advanced analytics applications also facilitate near-real-time interaction between producers and consumers of analyses. The ability to annotate features in the data by leaving time-stamped and named notes for later viewers of the analyses helps capture and codify the knowledge of those closest to the process.
Built-in mechanisms for scaling analytics are key to widespread adoption within an organization. Providing connectivity to existing asset hierarchy systems offered by process automation and historian companies, as well as by third-party vendors, is one way that modern applications address this challenge. For organizations without a built-out asset structure, mechanisms for constructing asset groups tailored to specific use cases exist in-application within a point-and-click environment.
Success Stories
Digital and analytics leaders in the chemical industry have embraced new self-service analytics technologies to exploit their data investments by solving increasingly complex use cases. Here, we’ll look at four that build on the foundational element of advanced event identification and then apply advanced statistics to generate monitoring limits, construct predictive models, and quantify dissimilarity and contribution factors among batches.
1. Batch Deadtime Identification. A bulk chemical manufacturer wanted to estimate the total production lost each year due to deadtime in batch processes across all its reactors. The company defined deadtime as any time when a procedural step critical to the outcome of the batch wasn’t taking place.
The chemical maker used an advanced analytics application to visualize process data from its historian with contextual information about the batch — a capsule with start time, end time, batch identity, and additional quality metadata. These capsules identified the time spent on each operational phase, e.g., charging, heat-up, reaction time and discharge. Phases were identified by increasing or decreasing trend in a signal, values exceeding a threshold, or by looking at a logical combination of other events. Ultimately, the company identified periods of deadtime by subtracting each of the productive reaction steps from the overall batch capsule (Figure 2).
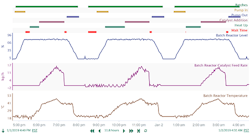
Figure 2. After identifying reaction steps, subtracting time spent on them from total batch time gives overall deadtime.
The manufacturer used a single production line to tune the analysis. It then applied a similar methodology to each of the other batch reactors within its facilities. This involved constructing an asset hierarchy containing the relevant batch database events and time-series signals for each reactor. With this asset infrastructure built out, the company was able to quickly toggle the analysis among reactors in a single click, as well as view summary metrics, like the total annual deadtime across all reactors.
With the overall deadtime opportunity identified, the chemical maker put in place monitoring activities and prescribed actions to eliminate deadtime, and then shifted its efforts to minimizing the duration of the productive steps in each batch.
2. Golden Profile Construction for Batch Quality Monitoring. For any repeated process, modeling future batches based on successful ones can provide significant value. A manufacturer can define success using a variety of metrics, e.g., a good quality result from a finished-product lab test, minimal energy expenditure while achieving procedural targets, a short production cycle for a given order quantity, etc. Using metrics from these successful cycles or batches to generate targets and boundary limits for critical process parameters (CPPs) during all events can ensure the success of future runs.
Variability in cycle length or sample frequency can cause difficulties. However, the biggest issue historically has been the static nature of calculated golden profiles. They’re built at one point in time based on a set of ideal or optimum cycles — but the golden profile might shift over time with variations in feed composition, sensor drift or process fouling.
Live data connectivity and automatically applied calculations enabled a specialty chemical manufacturer to build dynamic golden profiles for CPPs, with data from newly identified and logically defined golden batches incorporated in near-real-time.
The company identified its golden batches by creating capsules for batches that yielded a high product concentration. These golden batches served as an input into the point-and-click Reference Profile tool in Seeq, which enabled SMEs to calculate average and 3-sigma upper and lower limits for each CPP, including dissolved gas concentration (Figure 3).
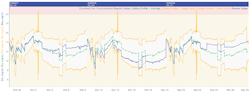
Figure 3. Because dissolved gas concentration significantly correlated to finished product concentration, profile, shown here for three batches, tracks that parameter.
The monitoring trends were combined into a dashboard with a date range configured to always show the current batch in production. Flagging of deviations with red capsules at the top of the trend alerted operations staff to take action to keep the batch on specification for the product concentration measurement.
3. Batch Yield Prediction Based on In-Process Data. Manufacturers often measure product quality after completion of batches by using lab tests to determine whether finished product is on-specification, off-specification or scrap. Off-spec and scrap products significantly hurt productivity, so maximizing the amount of on-spec product is critical to running a profitable business.
Accurate predictions of future quality measurements can inform process adjustments that help keep the finished product within on-spec limits. However, building suitable models requires knowledge of complex statistics, manual monitoring for deviations, and a feedback loop indicating what knob to turn and to what degree when the model begins to predict an off-spec result.
A specialty polymer manufacturer needed to achieve an average yield above 55% to maintain profitability but below 70% to prevent excessive fouling of downstream equipment. It historically had used a feedback-style control mechanism to keep yield within range, adjusting CPPs like reactor volume, temperature or reactant concentration after an out-of-range yield measurement appeared. At that point, though, unrecoverable raw material losses or downstream fouling already had occurred.
Rather than continue operating this way, the company used an advanced analytics application to build a model to predict the yield of a completed batch based on sensor data as the batch progressed. It utilized point-and-click tools to calculate summary metrics for each signal during each batch, and found that both the maximum reactant concentration and maximum reactor temperature significantly correlated with yield.
The manufacturer developed a regression model to predict yield based on these key performance indicators, and used the coefficients to calculate manipulated-variable control adjustments when an out-of-range yield value was detected. By implementing in-process adjustments informed by the prediction model, the company substantially reduced raw material losses and extended the interval for maintenance to remove fouling from downstream equipment.
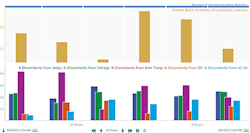
Figure 4. Visualizations of dissimilarity measurements and time-series trends ease identification of root cause of variance and appropriate corrective action.
4. Quantifying Batch Dissimilarity from a Golden Batch. A specialty chemical manufacturer relied on a batch electrochemical process to produce precursors to high-volume synthetic fibers. Specialized equipment inside the reactors often suffered damage when batches didn’t run as designed. The company wanted a better way to spot batches where deviations from established procedures occurred, and to find root causes of the deviations.
It began by using Seeq capsules to identify a few ideal batches. SMEs examined trends of the five manipulated variables in the batch process, looking for the characteristic setpoint changes and ramps specified by the procedure. After differentiating the ideal batches from all others, they took advantage of the extensible tools panel in Seeq to run an advanced algorithm.
The company used the Multivariate Pattern Search Add-On algorithm for Seeq (open source) in batch mode to quantify the dissimilarity of each batch from the ideal procedural batches. The algorithm’s output included not only the overall dissimilarity percentage but also which signals, and indirectly the execution of which procedural steps, deviated from the ideal.
The algorithm was configured to run on a schedule, updating after completion of each new batch. Visualizations like the one shown in Figure 4 were combined into a report where SMEs could view batch dissimilarity measurements alongside the time-series trends for a particular batch, and then quickly identify the cause of the dissimilarity and correct that step in the procedure before the next batch began.
Key Considerations
Advanced analytics applications need access to all relevant real-time data sources. These data frequently lack consistent metadata structure and asset association for analysis and, so, require a preparatory contextualization step before analysis. An SME very familiar with the process, in this case batch operations, must perform this data contextualization, even when the advanced analytics application provides some degree of automated data alignment, cleansing and aggregation.
Selecting the right advanced analytics application is important. The wrong tool, in the best case, will add significant time and effort to the analyses; in the worst case, it will yield results that are confusing and break down trust between information technology (IT) and operational technology (OT) teams.
Even with effective data wrangling and a suitable application, finding the best solution in these types of complex analyses often requires an iterative approach that takes time. Also, a company must dedicate one or more SMEs to working with the selected advanced analytics application; these types of experts often are in short supply.
A typical misstep occurs when those unfamiliar with the process use artificial-intelligence or machine-learning algorithms in a silo. Another issue arises when the selected tool requires a high level of IT expertise; this is very hard to find among SMEs.
A better approach is to maximize the productivity of a company’s SMEs by giving them a tool that doesn’t require extensive IT expertise but does empower them to directly interact with the data of interest in an iterative fashion.
ALLISON BUENEMANN is an industry principal at Seeq Corporation, Seattle. Email her at [email protected].