How Good Are Techniques For Handling Abnormal Situations?

Do alarm management and upset automation (safe park) really improve operator and plant performance? In theory, good alarm management will result in more concise information to direct the operator to a problem while upset automation should relieve the operator of routine tasks, freeing the person to focus on monitoring and troubleshooting. To date, though, faith rather than proven results has underpinned their use. Alarm management has been shown to reduce the number of alarms and provide better prioritization. Upset automation has been shown to cut the number of control actions necessary during an upset. However, can tests demonstrate that either or both techniques actually improve plant performance during an abnormal situation? And if so, by how much?
This was the subject of an investigation by the Center for Operator Performance. The goal was to measure operator and plant performance in response to an abnormal situation. Use of actual operators and a high-fidelity simulator would ensure the results reflect real-life as much as possible. The experimental design, developed by human factors researchers from Embry-Riddle Aeronautical University, Daytona Beach, Fla., added to the confidence that the outcome would accurately indicate the effectiveness of alarm management and upset automation.
Method
The study focused on the indoor control-panel operating tasks for the finishing side of ethylene manufacturing. It used a high-fidelity dynamic simulation of the cold side of the process, modeled by software from CORYS, Grenoble, France (lead photo).
Simulated scenario and independent variables. The simulation began with a malfunction of the propylene refrigeration compressor unit (i.e., “601 trip”); hence, the plant was in “upset” mode and not steady state. When the refrigeration compressor unit trips, the control room operator must isolate the plant, which includes closing valves, shutting off pumps, and flaring (i.e., burning off excess gases). As the operator was isolating the plant, a valve malfunction occurred. This involved an open valve that the operator closed as part of the standard procedures following the 601 trip. The issue was that the operator’s display showed the valve as closed but it actually remained open in the (simulated) plant. The operator’s task was to detect the valve malfunction while continuing to resolve the 601 trip. Accomplishing this required approximately 100 process moves. The simulation specialist administered the modeled scenarios and acted as a role player when necessary (e.g., responding as the “cracking panel operator” and “outside operator” during the scenarios).
Alarm design. The study included two types of alarm design. No rationalization (which yielded approximately 250 alarms) and smart/state-based alarms (which gave approximately five alarms).
Automation. The study also incorporated two levels of automation: presence or absence of the safe park application. With safe park, operators would perform approximately eight moves in responding to the simulated events. Without the safe park app, operators would carry out approximately 120 moves in response to the simulated events.
Study conditions. Each operator experienced four separate, simulated scenarios:
• Safe park automation app:
Scenario A — no rationalization;
Scenario B — smart alarm;
• No safe park automation app:
Scenario C — no rationalization; and
Scenario D — smart alarm.
To avoid learning effects, the study used four different scenarios (one per study condition) with the malfunctioning valve differing in each.
Measures. Each operator’s perceived workload level and the flare released were measured. A subjective questionnaire, NASA-TLX, measured the perceived workload. Every operator completed the NASA-TLX after each simulated scenario, resulting in four unique workload scores per operator (one per scenario). The amount of flare (i.e., the amount of excess chemicals released) was recorded by the simulator’s historian function. In the actual plant, after a 601 trip an application reduces furnace feed by 22% within 3 minutes. For consistency in this study, the feed rate was left at that level, although in a non-simulated 601 trip event, operations would have cut the feed rate further. The total flare released was collected by importing historian data into a spreadsheet in one-minute averages. The averages then were totaled over the period of time between the onset of the first alarm and when the operator identified the anomaly.
Procedure. Upon arriving for the simulation day, each operator completed the scenarios one by one. The order of the scenarios for each operator varied, being randomly assigned, to avoid order effects. Each scenario lasted between 10 and 45 minutes. After finishing a scenario, the operator completed the NASA-TLX questionnaire. The simulation specialist then debriefed the operator about the scenario and the operator was given a short break. This process repeated until the operator had gone through all four scenarios.
Testing And Results
Eleven finishing-side operators currently employed at an ethylene facility in Canada participated. All the operators were shift workers on a five-week rotating schedule who were slated for their required simulation-based training. They were active panel operators and familiar with the equipment, processes and procedures of the particular plant and specific to their job. The operators experience levels ranged from several months to 30 years; the average was about 7 years.
The operators were informed in advance that the scenarios involved a propylene refrigeration compressor trip, which is documented in an emergency procedure, and that a secondary valve failure also would occur. The details of the valve failures were not disclosed. Each operator completed all four scenarios on a single day.
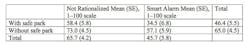
Table 1. Alarm design and automation affected perceived workload. (SE is standard error of the mean.)
To ensure consistency, a script was created for implementing each step at the same time for all the scenarios. This included all the required steps by the cracking panel operator and field operator as well as changes to the simulator. The simulator trainer performed the steps and gathered the results. In addition, a feed ramp and a program to shut down pumps in the same sequence and timing was used. A process historian validated the timing of the results entered by the trainer.
Tables 1 and 2 show the descriptive statistics. Use of safe park significantly impacted operator perceived workload and the amount of material flared. Specifically, operators indicated lower perceived workload and the system released less material to the flare when using the safe park automation compared to without it. In terms of alarm design, operators reported substantially lower perceived workload when using smart alarming versus the non-rationalized alarm schemas. However, about the same amount of flare was released with non-rationalized and smart alarming. These statistically significant reductions in the performance variables measured in this experiment present valuable evidence that implementing alarm rationalization schemas and automation techniques to assist the human operators does improve system performance.
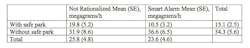
Table 2. Alarm design and automation also impacted the amount of flaring. (SE is standard error of the mean.)
Implications
The risk of a loss of containment event increases during outages because of the sudden changes in pressure and temperature. Freeing up the panel operator from the bulk of the tasks and preventing emergency alarms from being buried in an alarm flood can allow operations to recognize these events early and respond quickly to minimize their severity.
Using alarm automation to reduce the number of alarms to five for a unit outage was new; this was termed a “no brainer” by some of the operators involved in the test.
The operators were familiar with the upset automation, as it was implemented at the site shortly after the start of the simulator training program 20 years ago and has been very helpful in unit upsets. We now have data that support the benefits. One of the keys to developing upset automation was testing the software on the simulator.
Overall, results showed dramatic improvements for use of advanced alarming techniques (state-based) and upset automation. Operator response time, mental workload and flaring were reduced by 35–70%.
RON BESUIJEN is a technical training specialist at a major Canadian ethylene producer. BETH BLICKENSDERFER is a professor at Embry-Riddle Aeronautical University, Daytona Beach, Fla. JOSEPH R. KEEBLER is an associate professor at Embry-Riddle. RICHARD SIMONSON is a doctoral candidate at Embry-Riddle. DAVID STROBHAR is principal human factors engineer for Beville Engineering, Dayton, Ohio, and a founder of the Center for Operator Performance. Email them at [email protected], [email protected], [email protected], [email protected] and [email protected].