Successfully Implement the Industrial Internet of Things
Chemical and other process plants can gain substantial benefits from the Industrial Internet of Things (IIoT). However, sites often struggle when implementing an IIoT application — particularly when engineers who aren’t automation specialists tackle such a project. They frequently face challenges in five areas:
1. Technology. There are many technical buzzwords, and some vendors may say they can solve all your technical problems. However, what’s right for your organization? Can you leverage any of your existing infrastructure?
2. Networking. What things should you use IIoT to connect, and how? Will these connections be secure? How does this change the Purdue Model (the hierarchical architecture of information flow in an enterprise)?
3. Organization. Many IIoT projects span areas handled by operation technology (OT) and information technology (IT) groups. How do you leverage the benefits of automation for the entire organization by getting these groups to work together?
4. Sustainability. How do you start small while still preserving scalability? How do you maximize uptime? How do you maintain the system?
5. Business Case. How do you justify infrastructure, applications and change management by showing a positive bottom-line impact?
Many plants and processing companies are very siloed — with responsibilities separated among diverse groups such as ones for process equipment, control systems, instrumentation, reliability, operations, safety, finance, accounting and management. However, maximizing IIoT benefits requires cross-functional coordination.
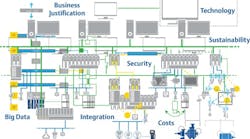
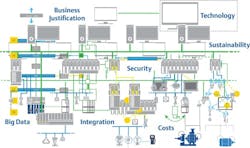
When you look at the IIoT through a cross-functional lens as depicted in Figure 1, the challenge seems formidable.
Figure 1.The IIoT touches a lot of elements, which can make implementation seem daunting.
Thankfully, there’s a methodology for simplifying IIoT implementation, making it understandable for the typical process engineer in a chemical plant.
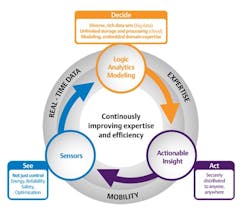
The first step toward simplification and understanding is to adopt an application model to evaluate possibilities. In general, IIoT options automate the collection of data from the field, process these data, and then deliver the results to the right person for corrective action. Figure 2 represents a simple see-decide-act model scalable from a single process unit to the enterprise level, and applicable to any functional work group.
Using this simple model, it’s possible to create: a list of cross-functional applications starting with current initiatives; a report to detail requirements to achieve top-quartile performance; and a compendium of complaints, desires and pains from various departments such as operations, maintenance, safety and environmental. This also is the appropriate time to put together a cross-functional working group with representatives from all these areas.
[callToAction ]
Calculating Annual Savings
Determining the return on investment (ROI) and business justification for an entire IIoT implementation can be difficult. Thus, it’s best to break the task up by application (e.g., as in Table 1). Typically, one or two key applications can justify an initial IIoT infrastructure installation — and reduce the cost of implementing subsequent applications.
For example, suppose a plant must monitor 100 pressure relief valves (PRVs) for compliance but has no wireless instrument infrastructure. The typical cost of a wired installation is $18,000 per point while a wireless implementation is $3,000 per point, which includes adding the wireless infrastructure. (The cost for wireless PRV monitoring breaks down to about one-third for wireless acoustic instruments to detect valve lifts and two-thirds for the new wireless infrastructure.) Opting for wireless would result in $1.5 million in project savings — or more if the wireless infrastructure spending is amortized over other projects. In many situations, an IIoT infrastructure will pay for itself through project savings and ongoing operational benefits from just a single application.
Table 1. A medium-size chemical plant usually can find a variety of initiatives that offer fast payback.
Suppose the PRVs are scattered across the site and providing proper coverage requires ten wireless gateways, each of which can connect up to 100 wireless instruments. The wireless option not only saves $1.5 million for the initial project but also provides 900 spare input/output (I/O) points for other applications.
If the wireless infrastructure already existed, project cost would drop dramatically — and primarily would involve installing additional wireless instruments — plus some small amount for integrating the information from these instruments into the control and monitoring systems.
In general, a wireless project typically costs 25% less and takes only 25% of the time of one using a traditional wired approach. These wireless projects provide the foundation for an IIoT implementation, as they automatically supply data previously inaccessible due to cost.
Annual savings realized by wireless applications accrue in several key areas: lower cost for compliance; increased production; reduced maintenance expenses; decreased exposure to hazardous environments; and more productive use of staff (by switching personnel from routine inspections to higher-value work).
Many engineers find it challenging to determine these estimated annual savings. An industry consultant or process automation vendor can assist in evaluating the cost-effectiveness and ROI of options by holding meetings with various plant groups, doing a walk-through, evaluating what needs to be done, and providing estimates of annual savings — along with technology recommendations.
Once annual savings are estimated, the next step is calculating costs.
Figuring Implementation Costs
The calculation process starts by understanding the requirements and costs for each application. From these, you can develop general infrastructure requirements that will include leveraging existing infrastructure as well as adding infrastructure as appropriate. The key is a method to see the common requirements and features across many applications for different functional groups in the plant such that the value and costs can be shared.
Figure 2. The see-decide-act model works for a single process or an entire plant.
Traditionally, instrument data came through the automation system used for control, typically a distributed control system (DCS). Other process data were manually collected or ignored altogether. However, when applying the capabilities of IIoT to solve problems outside fundamental control, it’s often simpler and more cost-effective not to go through the control system. A more-efficient IIoT infrastructure can provide this new path, delivering the right information to the right person.
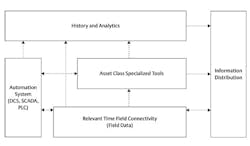
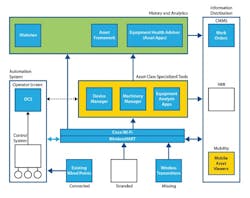
The distributed information system (DIS) model shown in Figure 3 provides a basis for summarizing the general requirements for individual applications and IIoT Infrastructure. Its five boxes indicate equipment or technology, while the dotted lines show potential paths for communication. The DIS model allows a user to understand the fundamental data flows without being bogged down with technology and implementation requirements. This enables calculation of ROI for individual applications and creation of an IIoT architecture.
Let’s look at the five components in the model:
1. Relevant Time Field Connectivity. This component represents the process areas and the three types of raw data: data already connected to the automation system; data stranded in sources like programmable logic controllers, analyzers and third-party skids; and data missing or subject to a manual round. These data are labeled as relevant time data because they’re collected at a rate sufficient for the application, usually slower than the once-per-second rate typical for points connected to the DCS. Generally, WirelessHART instrumentation serves for automating the retrieval of missing data due to cost savings but cellular and Wi-Fi options or traditional wired instruments also can handle the task.
2. Automation System. A large amount of data already may exist in the automation system; augmenting — rather than duplicating — these data often can reduce costs. In some applications, incremental data belong in the automation system but, in most cases, the historian or an asset-class specialty tool should be their end destination.
3. Historians and Analytics. Most sites have a platform that serves as the repository for data from the automation system. Such a platform can be used for processing incremental data from the field; addition of data analytics software can simplify the process of turning data into information. In many cases, all the data required to monitor an asset already exists and the value comes from adding the right data analytics package to create the information.
Figure 3. This DIS model can help define requirements for individual applications and IIoT infrastructure.
4. Asset-Class Specialty Tools. These tools and interfaces for specific roles and work groups often use field data that don’t belong in the historian or that require pre-processing before going to the historian. Prime examples are instrument diagnostic data and vibration waveforms from rotating equipment.
5. Information Distribution. To be of value, actionable information must reach the right person. Data destinations include: automated work orders to a computerized maintenance management system (CMMS) resulting from new analytics in the historian; traditional human-machine interfaces and mobile apps; and remote connections to the field using Wi-Fi.
Developing A General Infrastructure
For decades, the Purdue Model has been the standard method for describing information flow in automation systems. In the Purdue Model, information always flows up, from the process sensors to the I/O system, through various networks, to the control system. From there, it continues to flow up to process historians, manufacturing-execution-system and CMMS software, and then to corporate databases.
Many plants make the mistake of trying to figure out how IIoT aligns with the Purdue Model before understanding the needs of their organization and the value of IIoT options. This causes three key problems. First, some engineers unfamiliar with the Purdue Model may choose not to take part. Second, OT and IT groups, citing assumed security issues, may refuse to participate in or endorse efforts. Third, a lack of key applications to drive ROI could result in low utilization of infrastructure.
The DIS model reduces the technical details down to the simplicity of see-decide-act, easing ROI calculations. The summary ROI of all the proposed applications can justify efforts by getting past the technical barriers and into a state of managed risk. The summation of individual-application DIS models into a general DIS model can then serve as the template for developing the IIoT infrastructure.
Using the examples in Table 1, Figure 4 represents the general DIS model for several applications. It combines DIS models created for each application and, thus, shows general requirements through overlaps in infrastructure usage.
You can implement each application in stages such that the entire infrastructure is scalable, while providing future applications and infrastructure with a build-to blueprint.
Figure 4. Summing the results of individual DIS models provides an overview of general requirements.
Using The Approach
For the chemical plant already cited, the monitoring of 100 PRVs was the key driver, initiated by a request from the health, safety, security and environmental (HSSE) group to comply with new regulations. Following the see-decide-act model, a wireless infrastructure consisting of ten WirelessHART gateways was installed, and data from the 100 wireless acoustic transmitters monitoring the PRVs were routed to a PRV app residing on a server. HSSE personnel now receive alerts and data for corrective action and environmental reporting.
The reliability group — prompted because monthly vibration inspections didn’t suffice to prevent failure of critical rotating equipment — then started an initiative for more-proactive monitoring. This involved adding wireless vibration transmitters and routing data from these instruments to an existing asset management system previously used to store data from manual rounds. Data became available in relevant time, once every few seconds instead of after each round. Some manual inspections still took place, but less frequently.
Process engineers, seeing the value gained by the HSSE and reliability groups, decided to better monitor the health of compressors and large heat exchangers. Data had been collected manually from pressure gauges and with local measurements of heat. Wireless instruments were installed to measure pressure and temperature, replacing manual rounds. The data from these instruments were combined with existing data in the plant’s historian and sent to the facility’s asset-class analytics software (Plantweb Health Advisor applications), which contain pre-made analytics and dashboards. As a result, the plant now can see overall health metrics, which are correlated with production and used to generate work orders that go to the existing CMMS system.
The plant also was facing issues common to many sites — employee attrition and the need for modern tools appealing to a new generation of workers. So, it launched a general initiative for worker efficiency. Complicating matters, its control rooms were far removed from the process units, hampering operators’ ability to remain connected between the control room and the process units.
The plant set up a mobile workforce system so workers could access data via tablets and smart phones. Pump, steam trap, PRV and other monitoring and analytical apps now send data, analyses and reports to the cloud from which workers can retrieve the information via secure browser-based interfaces.
Developing An IIOT Vision
The DIS model provides an effective way to define the requirements for each application. Summing their estimated benefits and implementation costs determines the total ROI. Summarizing the ROIs for individual applications, along with the required data flows, creates an IIoT vision for implementation in phases and justifies the effort of working through the technical details.
Typically, the ROI of one or two applications will justify an entire plant IIoT wireless infrastructure. Even though not all applications will get implemented on day one, the general infrastructure will reflect their individual needs. By following the steps outlined in this article, an organization collectively working together to drive the IIoT implementation can achieve scalable and future-proofed deployment.
DAN CARLSON is a solution architect at Emerson Automation Solutions, Shakopee, Minn. Email him at [email protected].
