Combine Wireless With Analytics To Improve Efficiency
Plant managers always are looking for ways to improve operational performance or reduce costs. This effort involves many elements; much hinges on the condition and performance of process equipment. Getting a handle on relevant metrics requires effective instrumentation and data analytics — which often can pose challenges due to a lack of measurement points and the complexity of data analysis software.
Most plants consist of a collection of process units, many custom designed for the particular service, with supporting subsystems, often purchased as modules or skids. Here, let’s focus on such subsystems. In many instances, they are left out of an evaluation entirely or considered secondarily. However, these subsystems frequently provide significant opportunities.
Types Of Subsystems
We can divide subsystems into two categories: active and passive.
Active subsystems have their own automation capabilities, even if they are on a small scale. For example, consider a chemical mixing and injection skid to draw product from two chemical tanks, mix them in a specific proportion and pump the mix into the larger process unit at a desired rate. It usually would have its own instrumentation (level for the tanks, flow meters, pressure transmitters, etc.) plus a programmable logic controller (PLC) to read the instruments and regulate the functions. The distributed control system (DCS) running the larger unit tells the PLC what it should be injecting into the process. The PLC handles the internal functions of the skid.
This relieves some of the loading from the DCS because it doesn’t have to manage all the smaller functions of the skid. On the other hand, quite possibly neither the DCS nor the plant’s maintenance department get any substantial amount of diagnostic data from the skid. Presumably the skid, at a minimum, does send an alarm to the control room if it can’t do its job because a pump has failed or one of the chemicals has become depleted. That may be the extent of its condition monitoring and reporting capabilities, though. Some skid builders can build in more-sophisticated monitoring capable of sending more-granular information, such as the level of the chemical containers, condition of the pumps and so forth. However, this adds expense and usually won’t be done unless the customer specifically requests such capability.
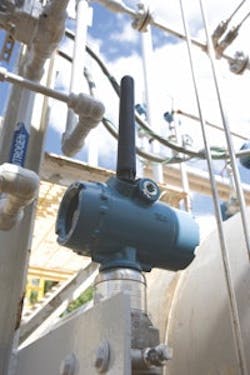
Figure 1.Native WirelessHART devices like this one have an internal power module, avoiding the need to add cabling of any kind.
In contrast, passive subsystems have no internal automation or control capabilities. A heat exchanger controlled entirely by the DCS is a good example. The subsystem itself is essentially mechanical.
In both situations, getting the kind of detail necessary to make useful evaluations will require adding instrumentation if more data are needed, and then analyzing the data from existing and new instruments to create actionable information.
What Data Are Available?
Returning to our chemical injection skid, let’s say the control room wants to know how much of each chemical remains in each tank. Several considerations play into this:
• What kind of level measuring device did the builder put on the skid? Is it simply a switch that sends a low-level alarm or does it monitor the whole scale from full to empty?
• Does the PLC running the skid look at the full scale or does it only care about crossing a critical line?
•Is the PLC set up to report the level measurements to the control room or does it lack that functionality?
So, you must ask if the variable of interest is being measured and if accessing the data is possible. The answer could be no —on one or both counts.
In such a case, you many need a path to talk to the field device or additional instrumentation. If the skid has a full-scale level device, such as a differential pressure (DP) or a guided-wave radar (GWR) instrument, it may be possible to add a wireless converter. If the transmitter uses 4–20-mA plus HART, you can install a wireless adapter to send the relevant process data to the plant’s WirelessHART network. This need not interfere with the connection to the PLC, so the level transmitter can continue to do its job in terms of process control.
If the level devices on the skid aren’t suitable, you may need to add an entirely new instrument; a good choice usually is a DP or GWR device with native WirelessHART (Figure 1). Other technologies are also adaptable using 4–20-mA-to-WirelessHART adapters. If you have a network in place but it doesn’t have spare capacity, it’s fairly simple and inexpensive to expand it; this almost always offers a cost-effective option.
Considering skids and modules more broadly, dozens of different performance and condition-monitoring applications may be pertinent, depending upon the nature and complexity of the subsystem. If the PLC or other controller can’t readily deliver information as to what’s happening, you will have to reach in from the outside —WirelessHART can help accomplish this task. Hopefully, you only may need to install wireless adapters because all points of measurement already are in place. If adding new points of measurement is necessary, this will be costlier and may require downtime for process penetrations. However, you at least will find a growing roster of native wireless instruments from a variety of vendors.
A Need For Instrumentation
Passive subsystems like heat exchangers may have little or no instrumentation of their own. Any regulation and measurement of product flow probably occurs elsewhere in the process. Operators in the control room certainly will know the main product flow. However, they might not pay attention to steam or natural gas consumption unless demanded by process issues.
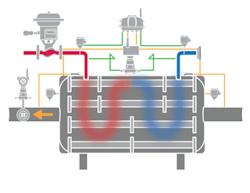
Figure 2. A simple instrumentation deployment can provide all the information necessary to calculate heat exchanger efficiency in real time.
Let’s look specifically at a shell-and-tube heat exchanger. The surface area available for heat transfer and the tubes’ heat conductivity characteristics are fixed. So, the maximum theoretical heat transfer depends upon fluid flow rates and the temperature differential between the two fluids. This can be calculated for a specific set of temperature differentials and flow rates. Any deviation from the calculated maximum indicates a loss of efficiency that raises the operating cost.
Efficiency losses typically stem from fouling or other material deposited on the surface of the tubes that acts as insulation. Such deposits can appear on one side of the tube wall or both, depending on the conditions. The challenge becomes determining how far the unit is running from its maximum and where the fouling might be occurring. Instrumentation can provide critical insights.
Figure 2 shows a fully instrumented heat exchanger. This calls for four temperature sensors, one DP transmitter and one flow meter:
• The process-fluid inlet and outlet as well as the transfer-fluid inlet and outlet have temperature sensors, so any changes can be measured.
• Because the unit’s DCS regulates process-fluid flow, the flow rate already should be available. However, it’s valuable to measure DP across the tubes with the DP transmitter’s high side tied to the inlet and the low side to the outlet.
• The transfer-fluid flow may be measured somewhere in the system. If it’s not, or the value isn’t easily accessible, it’s helpful to have a flow meter on the outlet.
Experience shows that wired instruments generally aren’t viable because of the high cost of wiring these devices back to the DCS. Fortunately, wireless instruments often can make such installations feasible.
WirelessHART provides an easy way to capture all these readings with the least hardware and most-efficient data streams. Some WirelessHART temperature transmitters can send data from four sensors on one wireless signal, reporting each reading in turn; the host system sorts out the data and updates each sensor reading individually. A native WirelessHART transmitter can handle the DP readings across the tubes. Similarly, a self-contained DP-based device available as native wireless is an excellent choice for flow measurement.
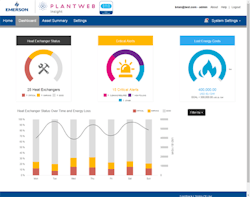
Figure 3. New monitoring app reads data from wired or wireless sensors and performs sophisticated analyses.
Of course, you always must balance the cost of these WirelessHART instruments and the possible downtime from installing them against expected benefits.
Presuming you can justify installing this arrangement of instruments, you certainly will get some valuable data.
By knowing the temperature change and flow rates of both fluids, it’s possible to determine how closely the heat exchanger is running to its theoretical limit. This can provide an early warning of when to take the unit out of service for cleaning.
If the efficiency loss stems from fouling, the instruments help determine the side of the tube wall on which the deposits are forming. Rising DP readings across the tubes, outside of those resulting from a change in flow, suggest the deposits are on the process side. (The recommended set-up doesn’t include a DP reading across the shell side because the internal free passage around the tubes is much larger. Deposits sufficient to cause a significant change on the shell side likely would lead to a drastic loss of efficiency.)
Data Analysis
Of course, properly evaluating the data generated is essential. Automation system providers have created platforms to support broad analysis of a wide variety of plant assets, from gas turbines to control valves. These can be hugely effective for large-scale implementations but often aren’t cost effective for monitoring just a few items of equipment.
To make analysis more cost effective, a new type of tool has emerged, drawing from concepts developed by the consumer electronics industry where sophisticated apps simplify user interactions. In this case, a heat exchanger app performs complex analysis to determine the overall health of a unit. When provided with some basic values related to the equipment configuration and data from the wireless (or sometimes wired) sensors, it becomes a simple matter to follow, record and analyze how the heat exchanger is performing. The dashboards provided operate independently from the larger DCS, so the basic process control functions go on as always.
Apps like these are dedicated to a specific type of plant asset or subsystem, and perform the appropriate analytics for that equipment. So, for example, an app to monitor the health of steam traps using data from acoustic monitors differs markedly from one designed for watching multiple functions on a motor/centrifugal pump skid. A user might not realize the extent of the difference because the dashboards can have very similar look and feel, even though the internal functions have little commonality.
Such apps can work in combination with active or passive subsystems because they connect with the instrumentation directly and don’t have to operate through a PLC or DCS.
These software and hardware combinations can provide critical information for equipment monitoring at far lower costs than traditional methods. In addition, they are simpler to implement and use because each app is designed to provide a specific function, instead of using a monolithic general-purpose analysis platform. Moreover, you can deploy these apps on an application-by-application basis without a commitment to a larger system, so you can evaluate their effectiveness and return on investment (ROI) (Figure 3). If the ROI suffices, then the plant can move on to the next item of equipment.
Compared to traditional methods, these new apps are easy to set up and test on a variety of installations and pose very low risk. For most applications, recognizing and quantifying the payback is just as easy as the initial deployment.
BRIAN JOE is wireless product manager for Emerson Automation Solutions, Shakopee, MN. Email him at [email protected].


