Pinch analysis, a tool from the ’80s, is very much alive and appropriate for discovering energy-saving opportunities. This methodology is still the only way to determine the best possible heat integration scheme for your process unit.
While in college, many of us learned about pinch analysis and what it can do to optimize heat integration in your plant. In this column, I will address the history of pinch analysis, the basic principles of this technology and show how to apply this knowledge to save energy and costs in your factory.
In 1971, Ed Hohmann revealed in his doctoral thesis that you can calculate the least amount of hot and cold utilities required to run a process without knowing the actual heat exchanger network. Furthermore, he determined the amount of heat exchange also can be estimated. Using this information, Bodo Linnhoff developed a technique known as a “Pinch Analysis” at the University of Leeds, U.K.
I always find these composite curves very informative in understanding the potential for improving heat recovery in a process unit.
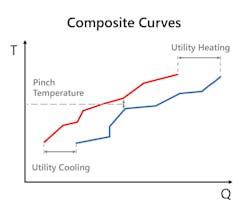
Pinch analysis relies on the composite curves as shown in Figure 1. The idea behind pinch analysis is that certain streams in a process unit require heating, and others require cooling. On the one hand, the feed stream to a unit from storage may need to be heated to a certain temperature before being fed to a reactor, or the heat required for a reboiler in a distillation column. On the other hand, some streams in the same process unit may need to cool. This may include products going into storage, the overhead condenser of a distillation column or reactor products that need to cool before further processing. Prior to using gas-fired heaters or cooling water exchangers, the heat recovery should be maximized from the streams that need to cool. Additionally, air fin coolers and cooling water exchangers must be minimized to reduce energy waste to the environment.
Follow three easy steps to get the composite curves:
- Add the energy (heat duty) from all streams in a process unit that must be heated.
- Add the duties from all streams that must be cooled.
- Plot this data with the individual stream temperatures on the Y-axis.
As a result, the horizontal axis will reveal the total amount of energy, or duty, required for heating and cooling. In Figure 1, the blue line represents the composite curve for streams requiring heating, while the red line shows the composite curve for streams that must be cooled. The point where the blue line approaches the red line (on the vertical axis) is called the “Pinch” temperature.
Depending on the level of heat integration, the blue line can shift either right or left. The blue line shifts right when there is less heat exchange with hot streams, meaning more energy is required to “heat” these streams. When the blue line shifts left, the heat exchange level increases, requiring more heat exchanger area. As a general rule, a hot stream should not heat a cold stream across the pinch temperature.
I always find these composite curves very informative in understanding the potential for improving heat recovery in a process unit. If the utility heating (often fuel gas or natural gas) and utility cooling (often air-fins and cooling water) costs are high, you can increase the amount of heat exchanger area to save energy. This scenario directly impacts CO2 emissions as well. As both energy costs and the potential impact on emissions rise, the heat integration of process units should be maximized. Hence, the cold composite curve (the blue line) gets very close to the hot composite curve (the red line).
Heat integration and heat recovery have always faced trade-offs between the cost of hot and cold utilities versus the cost of extra heat exchangers. In the current era of emissions reduction and rising energy costs, reviewing the composite curve of your process units regularly is worthwhile to determine if heat integration can be improved. This activity should be done on a regular basis, not just when designing a new plant, to determine if you are still following “best practices” based on the current energy prices and your process needs.


