Bernoulli’s theorem is one of the most used equations in fluid engineering. The theorem expresses conservation of energy in a flow system by relating velocity, pressure and elevation. Its basic form is for an incompressible fluid with inviscid flow:
½(v2/g) + (p/ρ) + z = c
where v is velocity, g is acceleration due to gravity, p is pressure at the location, ρ is fluid density, z is elevation above a reference plane and c is a constant in a unit of length. The term ½(v2/g) commonly is referred to as the velocity head and has units of height of the flowing fluid. It can be thought of as the amount of potential energy required to accelerate a fluid to its actual flowing velocity. It also is the amount of head generated when fluid velocity drops to zero.
However, pressure by definition is given in force per unit area. Because the basis for the simplified equation is incompressible flow, density is constant. So, multiplying both sides by ρ gives the familiar form:
½(ρv2/g) + p + zρ = cρ = C
where C is in force per unit area. The term p + zρ, which combines the pressure head (p) plus the elevation head (zρ), is the dynamic head of the system.
A quick example shows the difference in these forms. For a fluid with ρ = 25 lb/ft3 and v = 20 ft/sec:
Velocity head = ½(v2/g) = ½(20 ft/sec)2(32.2 ft/sec2) = 6.21 ft
Dynamic head = ½(ρv2/g) = ½[25 lb/ft3 × (20 ft/sec)2]/(32.2 ft/sec2) = 155.3 lb/ft2
Unfortunately, depending upon the industry, the term velocity head may refer to the height of fluid, the pressure in force per unit area, or either interchangeably. This can create confusion. Always make sure of the definition being used.
Velocity head and conversion to static or pressure head have many engineering applications. For example, let’s consider a distribution system. Liquid flows into a trough having multiple orifices to distribute the liquid across an area. All liquid entering the trough must exit by the orifices. In many systems our engineering evaluation and design assume even fluid distribution — but is that what we really get? How much will the distribution vary along the trough?
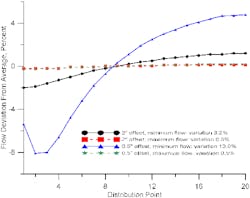
Figure 1 shows the results for two designs of a distillation tower distributor. The first has orifices two inches above the trough floor. The second design has orifices a half inch above the trough floor. At minimum liquid rate the fluid is two inches above the orifice — i.e., four inches above the trough floor for the first design and two and a half inches above the floor for the second. In both cases, trough height sets the maximum flow rate.
The desire is to keep the variation between the high and low rates across all distribution points to no more than 3%. For high quality distillation, this level of maldistribution is about as much as many systems can tolerate.
The distributor with the 2-in. offset from the bottom has a 3.2% variation of flow from minimum to maximum. In contrast, the distributor with a 0.5-in. offset from the bottom has a 13% variation in rates. The reason is that as the fluid moves along the trough, its velocity goes down. This causes the fluid to rise, increasing the elevation head available to drive liquid through the holes. The minimum flow rate is close to the entry of liquid into the trough. At that point velocity is highest, so the elevation head has been converted into velocity.
The curve for the 0.5-in. offset at minimum flow shows a second-order effect. A head must build up close to the inlet area to create the velocity needed. Then elevation drops as velocity increases and finally goes up again as velocity decreases.
Keeping track of these velocity gradients is key to making distribution systems work correctly.
What’s of special significance here is that if multiple troughs are used in parallel the flow errors are systematic. Flow tends to get distributed to the trough ends, near the tower wall. This increases the consequences of maldistribution.
Piping systems behave in the same way. Many tank mixing systems use a pipe with holes to distribute a feed into a vessel. At velocities found in many systems, careful observation will confirm the flow is strongly distributed toward the back end of the pipe. If this is a problem, pressure drop normally is the solution. Pressure drop is a tremendously effective distribution device in piping systems.
Understanding simple but important fundamentals often is the key to successful operation. The important fundamental here is the interplay of velocity, head and elevation.


