Energy Saver: Take The Heat Off Pinch Analysis
Pinch analysis is a powerful tool for designing energy-efficient heat exchanger networks. It has gained wide use for preheat trains in oil refinery crude units and fluid catalytic cracking (FCC) units, ethylene plants, and other large chemical and petrochemical systems (1).
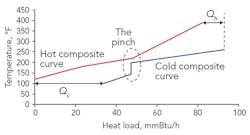
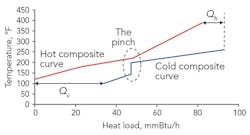
We all learned as children that heat flows from hot objects to cold ones. This simple concept is the basis of the hot and cold composite curves (Figure 1) that represent the overall heat release and heat demand of a process as a function of temperature.
The hot composite curve is the sum of all the heat sources (or “hot streams”) within the process, defined by their heat load and temperature level. The cold composite curve is the corresponding sum of all the heat sinks (or “cold streams”). We plot these curves together on a single temperature-enthalpy graph (as in Figure 1), from which we can see heat can be recovered within the process wherever the hot composite curve is above the cold composite curve — that is, heat can flow from a higher-temperature part of the process to a lower-temperature part. The heat flow takes place in heat exchangers, whose sizes increase as the temperature difference decreases. We therefore specify a minimum allowable temperature difference, ΔTmin, to ensure the equipment size doesn’t become too large.
Most composite curves show a pinch where the vertical separation of the curves approaches and eventually reaches the ΔTmin value. The pinch divides the process into two distinct regions:
• Above the pinch, some heat integration is possible (where the hot composite curve sits above the cold composite curve), but a net heat deficit exists, mandating an external utility heat source (Qh).
• Below the pinch, some heat integration is possible (where the hot composite curve sits above the cold composite curve), but a net heat surplus exists, mandating an external utility heat sink (Qc).
Figure 1. The curves represent the overall heat release and heat demand of a process as a function of temperature.
If we allow heat to flow from the region above the pinch, where a deficit of heat prevails, to the region below it, where a surplus occurs, both the deficit and the surplus will increase. So, we need more hot and cold utility duty to satisfy the process heat balance, and must consume more energy. This leads to the pinch principle: Don’t transfer heat across the pinch.
Composite curves and the pinch principle are the best-known elements of pinch analysis. Other tools and techniques include heat exchanger grid diagrams, grand composite curves, and algorithms to evaluate heat exchanger network area and capital/energy tradeoffs.
Pinch analysis was initially developed for new plant designs. Applying the technique for retrofit work requires modifications, because a revamp must account for existing equipment and plot space. The simplest approach is to identify major inefficiencies (i.e., places where heat crosses the pinch) in the existing heat exchanger network, and then find ways to eliminate — or at least reduce — them.
A wide range of pinch software is now available; engineers in many organizations conduct pinch analyses, at least at a basic level. Specialized consultants, typically in small companies, as well as some larger engineering companies, carry out most of the advanced pinch analysis work. However, pinch work shouldn’t be an isolated activity. Rather, it should be integrated into broader process design, energy management or process improvement programs.
Reference
1. Rossiter, Alan P., ‘Improve Energy Efficiency via Heat Integration,’ Chem. Eng. Prog., Vol. 106, No. 12, pp. 33-42, December 2010.
About the Author

Alan Rossiter
Energy Columnist
Alan Rossiter is a former contributor for Chemical Processing's Energy Saver column. He has more than 35 years of experience in process engineering and management, including eight years in plant technical support, design and research with Imperial Chemical Industries (ICI, United Kingdom) and nine years in energy efficiency and waste minimization consulting with Linnhoff March, before starting his own business. In 2019 he joined the University of Houston as Executive Director, External Relations for UH Energy. He is a chartered engineer (U.K.) and a registered professional engineer in the state of Texas. His latest book, Energy Management and Efficiency for the Process Industries, coauthored with Beth Jones, was published by John Wiley & Sons in 2015. He is a Fellow of the American Institute of Chemical Engineers and a Past Chair of the South Texas Section of the AIChE.

