The measurement of pH provides a resolution and rangeability in indicating process composition that is orders of magnitude better than any other analysis. With this exceptional capability comes an extraordinary sensitivity to the control strategy, controller, measurement, mechanical equipment, piping, and valve design and installation. A slight deficiency in any of these aspects that normally would be of no consequence to other control systems can cause a pH system not just to fail but to fail miserably. No other control system demands such stringent requirements for getting everything right.
Dynamic simulations can play a key role in success. They provide the details to understand the nature of the problem and to develop, prototype and test a solution. Making the simulations part of a virtual plant enables testing the actual control system configuration and displays, and training plant personnel to understand and work in concert with pH system to improve performance and onstream time. This translates into higher production rates and better product quality for process systems (e.g., crystallizers and reactors), elimination of environmental violations for waste treatment systems, and lower total lifecycle cost for all systems. The key innovative part of the simulation to achieve these benefits is the charge balance used to compute pH.
The charge balance documented by Shinskey in “pH and pION Control in Process and Waste Streams” [1] was generalized and extended to acids and bases with three dissociations by McMillan in “Advanced pH Measurement and Control,” 3rd Ed. [2]. Here, we further improve the charge balance to include monovalent, divalent and trivalent conjugate salts that greatly affect slope of the titration curve in the pH neighborhood of the logarithmic acid dissociation constant (pKa) of the associated weak acid or weak base. The charge balance provides a practical, fast and robust model for total system design that can deal with a complex mixture of ions. The concise generic form of the equations maximizes their flexibility and utility. While the equations just require dimensioned parameters and iteration, software with physical property packages, modeling of unit operations and virtual plant capability offers the greatest opportunities; it eases generating titration curves and enhancing pH-model fidelity by comparing slopes of the computed and laboratory curves in the control region. The model can be readily set up and modified by simple changes in concentrations and dissociation constants. Here, we look at the improvement of the charge balance to show its final form. We then provide an overview of how to achieve the model fidelity needed for all loop dynamics to increase control system capability, operability and reliability and, ultimately, to boost process performance.
Perspective
The charge balance developed by Shinskey showed an insight into how to develop a general-purpose equation not seen in the many publications on electrochemistry. However, Shinskey focused on a single weak acid or weak base with strong acids or strong bases, enabling a direction solution. For complex mixtures of multiple weak acids and weak bases, each with the possibility of multiple dissociation constants, finding the pH that satisfies the charge balance requires a search technique. We employ a simple interval-halving search where midpoint value of the charge balance determines the half of the search range used. (The extreme nonlinearity and rangeability of pH can fool more-sophisticated searches.) Interval halving is guaranteed to provide a solution and is extremely fast because the calculations are so concise. Convergence generally occurs after 10 iterations for a 0–14 pH range, with a resolution comparable to that of the pH electrode (0.01 pH). The specific equations in books on electrolyte modeling usually treat each solution as a special case. In contrast, the general form of the equations using the charge balance provides insight and flexibility to handle complex solutions.
We have improved the charge balance to readily include conjugate salts. While the effect of ionic strength is not currently directly addressed, the dissociation constants (pKi) can be corrected via the change in hydrogen ion activity with ionic strength per a Debye-Hückel equation. Process streams where the effect on activity coefficients is complex and large, where precipitation occurs, or solvents other than water are used require electrolyte modeling software. The pH models presented here are for dynamic modeling where the focus is on accurately finding and simulating the dynamics of the process response (e.g., process gain, dead time and time constants). What the control system sees is change, so getting the dynamics of the change is the role of these dynamic models for system design, implementation, testing and training. The robustness, speed and conciseness of the charge balance enable running virtual plants in real time and even faster than real time.
Charge Balance
We present here the final form of a straightforward and versatile charge balance for readily simulating the response of an aqueous system for control purposes. By using equilibrium relationships in conjunction with the charge balance, a simple yet robust function appears for rapid convergence on pH. (Details on the derivation of this simple charge balance appear online in Appendix A, while online Appendix B outlines an efficient interval-halving algorithm to solve the balance, and Appendix C provides a checklist of best practices for developing and taking advantage of the model. See the appendices.)
In many systems, a weak acid or weak base shares an ion in common with a salt present in the system. A system that has an ion in common can exhibit a “buffering” or resistance to changing pH, resulting in a flatter slope to the titration curve. This greatly reduces the local process gain (as indicated by the slope of the titration curve). If the control has a set point in this region, such buffering markedly decreases not only the sensitivity but also the difficulty of pH control. The loss of sensitivity lessens precision in terms of pH being an inference of acid or base concentration, but also diminishes the sensitivity to noise from mixing nonuniformity and limit cycles from valve backlash and stiction. This buffering is readily explained by Le Châtelier’s principle. Broadly, it states that a pressure on one side of a reaction (such as increased concentration) results in push in the opposite direction. So, in a system with acetic acid, the addition of sodium acetate contributes additional acetate to the system, driving the equilibrium back towards the undissociated form of acetic acid. With the addition of salt to the system, the effective concentration that appears in the system now depends upon the salts as well as the acid/base present. This appears as the “M” term in the expressions. Equations 1, 2 and 3 suit an acid or base with one, two and three dissociations, respectively:
M1 = [s/(1+P1)]×E (1)
M2 = {(2+P2)/[1+(P2×(1+P1)]}×s×E (2)
M3 = {[3+P3×(2+P2)]/[1+P3×(1+P2×(1+P1))]}×s×E (3)
(Strong acids and strong bases have logarithmic dissociation constants that are at the extremes or even outside the normal 0–14 pH scale.)
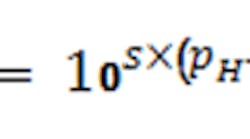
The factors P1, P2 and P3 are computed as needed per the general Equation 4 where pKi is the i-th logarithmic acid-dissociation constant (pK1, pK2 and pK3) and s simply is +1 for bases and -1 for acids:
The E term, computed by Equation 5, allows including the total effect of the common ions:
The equation can be formulated for either the i-th anion (for an acid) or i-th cation (for a base) contributing common ions where βi is the stoichiometric coefficient of the i-th salt’s ion contribution, Mi is the molarity of the i-th salt, Mab is the molarity of the acid/base, and n is the number of species contributing common ions.
Ionic species that are not common with an acid or base present in the system appear in the charge balance for the concentration CS via Equation 6:
where λ is the charge associated with the ionic species for the j-th ion with no corresponding acid (in the case of anions) or base (in the case of cations), n is the number of ions with no corresponding acid and base, βj is the stoichiometric coefficient and Xj is the concentration of the species j added to the system. (For salts not associated with acids or bases, the positive and negative ions added generally are equal, canceling out the effect on the charge balance. The effect of these salt concentrations mainly is in terms of ionic strength on activity coefficients, most notably that for the hydronium ion and hence the measured pH.)
Finally, the contributions of each M and CS are aggregated into Equation 7 for total charge balance:
where pKw is the negative of the base ten log of water dissociation constant.
Model Fidelity
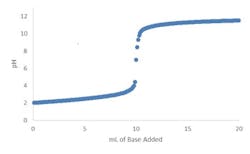
Figures 1 and 2 show the titration curves for a strong acid with strong base and a weak acid with a weak base, respectively. The slope of a true strong acid/strong base changes a factor of ten for each pH unit deviation away from the equivalence point (e.g., 7 pH for water at 25°C). Thus, the pH slope is 106 times steeper at 7 pH than at 14 pH; the reagent flow requirement to go from 8 to 7 pH is 106 times smaller than that to go from 14 to 13 pH. No straight lines exist, although lab titration curves may give that impression (Figure 1). Zooming in on the apparently vertical line between 5 and 9 pH reveals another S-shaped titration curve. Often titration curves generated in labs lack enough data points to reveal the shape of the curve and the change in slope in this region.
Figure 1. Zooming in on portion of curve from pH 5 to 9 would show that it is not really vertical.
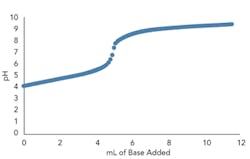
Fortunately, true strong acid or strong base systems are very rare. Just a trace amount of a weak acid or weak base (e.g., 0.01 normality) or its conjugate salt can moderate the slope and, hence, the sensitivity by four or more orders of magnitude (Figure 2). The greater the number and concentration of weak acids, weak bases and their conjugate salts, the more linear the overall titration curve becomes.
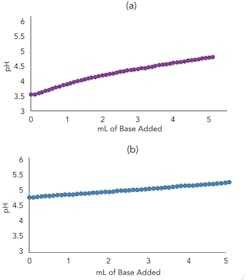
Figures 3a and 3b present the titration curve slope predicted by the model for a weak acid before and after the addition of a conjugate salt. As they show, the conjugate salt further moderates the slope of the curve.
For these curves and in the charge balance equations, the logarithmic base dissociation constant (pKb) is converted to an equivalent pKa (pKa = pKw-pKb) for ease of analysis and understanding because of the dramatic effect on the slope for an operating point near a pKa . The slope of the titration curve, i.e., the process gain, is very sensitive to the concentration of weak acids, weak bases and conjugate salts. The process gain determines not only the controller tuning and linearization requirement but also the precision necessary for the reagent delivery system, regardless of whether it relies on a control valve or a metering pump. You can generate the model titration curve simply by ramping the reagent flow from a starting pH that matches the plant pH when there has been no reagent flow for four or more residence times. You can do this very quickly online with your plant’s inline pH control system; because residence time is only a few seconds, generating a titration curve takes only a couple of minutes. Then, adjust model stream composition to match the plant stream composition based on plant samples.
Perform laboratory titrations with the sample at the same temperature as that of the process stream and with the same type of reagent used in the plant. Get at least 10 titration data points in the control region. Put the data points (pH and mL of reagent added) into a spreadsheet and note sample volume and any difference in reagent concentration between the lab and plant. (Labs often use more-dilute reagents.)
Figure 2. Trace amount of a weak acid or base or its conjugate salt markedly moderates slope.
Plot the plant titration curve as pH versus a ratio of reagent volume to sample volume for the reagent strength used in the actual pH installation. Also, compute the slope in the pH control region. Then, generate the same type of titration curve using the model and determine its slope in that region. Adjust the concentration of a weak acid or weak base or conjugate salt in the model to better match the model slope to the lab slope. For set points near 6 pH, adding a very small amount of carbonic acid (e.g., 10-4 normality) that is a result of carbon dioxide absorption merely from exposure to air often will achieve slope fidelity. While we are accustomed to thinking we exactly know the concentration of a process stream, incredibly small concentrations of ions (e.g., 10-6 normality) can affect the pH. Thus, treat the small adjustment of concentrations to achieve process slope fidelity a practical necessity.
How well the primary and secondary time constants and total dead time in the model match the plant also is important. Because most models use perfectly mixed volumes, the modeling of these dynamics involves first subtracting the mixing time (e.g., turnover time) from the total residence time (volume/flow) and then partitioning the remaining residence time into equivalent large and small volumes in series for the primary and secondary time constants, respectively. You can achieve greater fidelity for poorly mixed systems by further splitting the small volume into smaller volumes in series. To model the reagent injection delay, apply to the reagent flow a dead time equal to the injection volume (e.g., dip tube volume) divided by the reagent flow rate.
The model’s automation system components must match what is in the plant. The control-valve and metering-pump installed flow characteristic, resolution, dead band and 86% response time must be reasonably accurate. The pH-electrode’s 86% response time, which can be large for low velocities and for fouled, aged or dehydrated electrodes, must reflect what can happen in the plant. You also must include transportation delay to the location of the sensor. Introduce noise by adding a fluctuation in process stream component concentrations that corresponds to the degree of uniformity achieved by mixing. The proportional-integral-derivative (PID) controller should have the same form, structure and options (e.g., external reset feedback) as the one used in the plant. Find the controller tuning settings by auto-tuning software and use ratio control for flow feedforward.
Applicability
The model can be used to determine the type and degree of mixing, residence time, method of reagent injection, control-valve capacity and precision, and the number of stages of neutralization necessary. The tradition rule of thumb is that a stage of neutralization with a residence time of 20 minutes and a turnover time of less than 10 seconds is needed for every two pH units from the lowest or highest pH to the pH set point. Thus, a strong acid or base with a pH coming in below 1 pH or above 13 pH and a set point of 7 pH would require three stages of neutralization using well-mixed vessels (circular high-axial-agitated ones with baffles and a level about equal to the diameter). Opting for multiple precise valves with valve position control where a small valve is stroked in unison with a large valve, coupled with signal characterization to provide linearization per the titration curve possibly can eliminate one stage. Also, the use of an inline system upstream or in the recirculation line of a volume of any geometry with just an eductor can eliminate the need for a well-mixed vessel.
The model also can provide the details of the control valve and metering pump and reagent piping as well as the location and type of pH electrode. It can show the many benefits of triple electrodes and middle signal selection in terms of reducing the effect of noise and a slow electrode and riding out a single electrode failure of any type. The model also offers a powerful tool for developing, prototyping and testing the control system and operator interface design, including the use of signal characterization, many PID features, ratio control and adaptive control — and then for training the process and automation engineers and operators via a virtual plant.
Figure 3. Top graph (a) shows model titration curve slope for weak acid before conjugate salt addition (10 mL 0.005M acetic acid with 0.005M sodium hydroxide incrementally added) while bottom (b) shows slope after addition (5 mL 0.01M acetic acid and 5 mL 0.01M sodium acetate with 0.005M sodium hydroxide incrementally added).
Improve Operations
A pH model in a virtual plant not only can help realize a successful pH design but also minimize the total lifecycle cost by increasing the use of inline systems, precise valves and smart control techniques, and enhancing the understanding and training of operators, technicians and engineers.
CHRISTOPHER STUART is a software developer and REHMAN FAZEEM is a lead project engineer at Mynah Technologies, Chesterfield, Mo. GREGORY MCMILLAN is a modeling-control consultant for Mynah Technologies. DANIEL FORCINITI is a professor of chemical engineering at Missouri University of Science and Technology, Rolla, Mo. E-mail them at [email protected], [email protected], [email protected] and [email protected].
LITERATURE CITED
1. Shinskey, F. G., “pH and pION Control in Process and Waste Streams,” Wiley, Hoboken, N.J. (1973).
2. McMillan, G. K., and Cameron, R. A., “Advanced pH Measurement and Control,” 3rd ed., ISA, Research Triangle Park, N.C. (2004).
NOMENCLATURE
CS contribution of salt ions to a charge balance that are not in common with an acid or base
E molar concentration for a particular acid or base and its common ion
Mab molar concentration of the acid or base
Mk molar concentration for the sum of the acids or bases and common ions
Mi molar contribution of i-th ion to the charge balance
n number of species contributing common ions
pH negative of the base ten log of hydronium ion concentration
pKa logarithmic acid dissociation constant
pKb logarithmic base dissociation constant
pKi negative of the base ten log of equivalent acid dissociation constant for i-th dissociation
pKw negative of the base ten log of water dissociation constant
Pi pH factor for an acid or base with i dissociations
s sign of the particular ion contribution (-1 for acids and +1 for bases)
Xj concentration of species j added to the system
Greek letters
β stoichiometric coefficient associated with an ion in common with an acid or base
λ charge associated with an ion


