Correctly Evaluate Project Economics
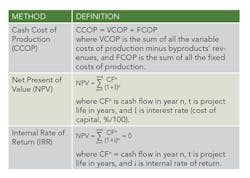
Economic analysis is a critical step in project evaluation and technology selection. Cash cost of production (CCOP), net present value (NPV) and internal rate of return (IRR), which are defined in Table 1, are the economic variables usually used to assess the multibillion-dollar investments that chemical manufacturers and refiners make. These economic variables can give misleading results if the analysis is based on poor assumptions.
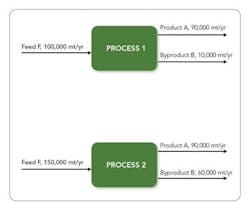
Figure 1. For the same output of Product A, Process 2 requires far more feed.
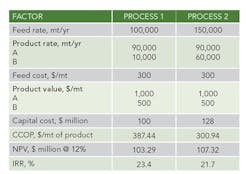
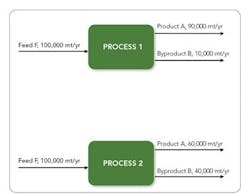
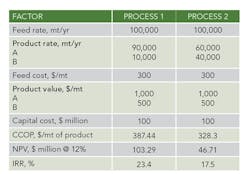
When evaluating different process technologies for a project, the designers select the option that has lowest CCOP, highest NPV or greatest IRR. These methods can be very sensitive to certain starting assumptions, potentially causing a less economical option to be selected. The following example illustrates this.A TELLING EXAMPLEConsider two processes to make the same products, A and B, from Feed F. Process 1 has 90% selectivity to A while Process 2 has 60% selectivity to A. Figure 1 shows the feed and product rates for making 90,000 mt/yr of A.Let’s suppose the capital cost (capex) of Process 1 is $100 million. We then can estimate the capex of Process 2 to be $128 million by applying the 6/10 rule, which assumes the processes have the same capital cost scaled to feed flow rate.C = C0 (FeedrateProcess 2 /FeedrateProcess 1)0.6where C0 is the capex of Process 1 and C is the capex of Process 2.A summary of feed and product flow rates and their respective prices for Process 1 and Process 2 appears in Table 2.Figure 2. For the same feed rate, Process 1 produces much less byproduct.
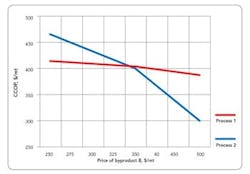
Figure 3. A byproduct price of $350 or more favors Process 2.
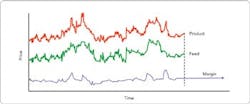
NPV analysis. As noted earlier, NPV increases with project size and, so, designers must exercise caution when using NPV as the economic criterion to compare large and small projects. Consider the examples summarized in Tables 2 and 3. At a constant product rate, Process 2 has the higher NPV because its poor selectivity leads to a larger plant and project size. However, at a constant feed rate, Process 1, which has better selectivity for the main product, has higher NPV. Such a discrepancy always will occur if the economic value of byproduct relative to feed covers the incremental capital cost due to the increase in plant size. The project becomes larger, requiring more capital and generating a less efficient return on investment, but the NPV increases. To avoid this particularly dangerous trap, never rely solely on NPV in evaluating processes that have different selectivity for the main product.IRR analysis. Because IRR is not as sensitive to the scale of the project and allows ranking investments based on their financial yield, it gives the same order regardless of whether the evaluation is conducted at a constant-product or a constant-feed rate. Moreover, IRR is not biased by process inefficiencies that result in a larger plant size or production of byproducts with lower value than the main product. In the above example, Process 1 has higher IRR than Process 2 under all circumstances.Using IRR also can help eliminate the challenge of determining the appropriate discount rate, or interest rate, for the investment. Only when the IRR lands near the hurdle rate for the project is more scrutiny typically required.From this analysis, we clearly can say that IRR is a more useful method than NPV or CCOP for selecting a process flowscheme or project. Also, it provides the true economic advantage (∆IRR between Process 1 and Process 2) when the economic evaluation is conducted at a constant feed rate. In many cases, upstream process conditions restrict the feed supply; however, even for an unconstrained feed supply, a constant feed basis still is preferable because it puts all process schemes (or projects) on the same basis and eliminates any biases due to project size or production of less valuable byproducts.Figure 4. Margin between product and feed prices varies far less than the prices themselves.
CONSISTENT PRICE FORECASTAn accurate project evaluation depends upon the choice of appropriate prices for the product, feed and utilities. In most cases, after the initial design and construction phase, a plant typically will operate for more than twenty years — so, the prices used in the economic analysis should reflect those forecast over the life of the project. As described in “Chemical Engineering Design” [1], most price forecasts are based on historic price data and several methods can provide predictions of commodity prices. These methods include linear regression of past prices, nonlinear models of price behavior and forecasting of margins. Linear regression of past prices is a good method for capturing long-term trends but can give misleading results depending upon the start date chosen. Nonlinear models can handle commodity prices that exhibit cyclic behavior. Unfortunately, both the amplitude and frequency of the price peaks usually vary somewhat erratically, making it difficult to fit the cyclic price behavior with simple wave models or even advanced Fourier transform methods. Another approach is to recognize that the feed and product prices usually are linked closely, because increases in feed costs usually result in product price rises. Therefore, although feed and product prices both may vary, the gross margin exhibits much less variation and can be forecast more reliably (Figure 4) [1]. The fuels and petrochemicals industry heavily rely on margin forecasts because it is much easier to predict the variation in margins than the underlying variation in the price of crude oil and natural gas. For project evaluation, showing that the prices used for economic analysis are realistic and consistent with consensus views of the market usually suffices. The process industries rely on a variety of utilities, such as steam, process water, cooling water, electricity and nitrogen. Plants usually generate these utilities using the most economical fuel available at the site; typical fuels include fuel gas, natural gas, fuel oil and liquefied petroleum gas. The marginal costs of utilities are based on the marginal cost of fuel. Using fuel equivalents (FEs) enables calculating the marginal cost of the fuel on a consistent BTU basis, taking into account both thermodynamic and mechanical efficiencies, and, thus, puts the marginal cost of any utility on a common basis. FE is defined as the amount of fuel energy (typically the lower heating value expressed in BTUs or equivalent) required for producing an amount of utility:FE = (Heat content of fuel consumed)/(Amount of utility produced)The selection of utilities depends upon the heat requirements, the temperature at which the heat is needed, and the availability and price of different fuels or energy sources. It is crucial always to compare the price of each utility on an FE basis. Substantial differences in prices can create an artificial bias in technology selection. For example, a very low price for natural gas and a high price for steam does not necessarily signify that a process using fired heaters instead of steam heaters is preferred. Rather, it could indicate that the site should add boiler capacity.
RAJESWAR GATTUPALLI is lead R&D scientist, CLAYTON SADLER is process design development manager, LAURA LEONARD is principal development specialist and GAVIN TOWLER is chief technology officer and vice president at UOP, a Honeywell company, Des Plaines, Ill. Email them at [email protected], [email protected], [email protected] and [email protected].
LITERATURE CITED
1. Towler, G. and Sinnott, R.,“Chemical Engineering Design,” 2nd ed., Butterworth-Heinemann, Burlington, Mass. (2012).

