Chemical processors rely on batch distillation for a variety of tasks, including eliminating impurities/unwanted components from reaction mixtures, removing water and drying, changing solvent between reaction stages of multistage syntheses, concentrating prior to crystallization, controlling temperature of strong exothermic reactions at reflux, recovering solvent, and fractionating complex mixtures.
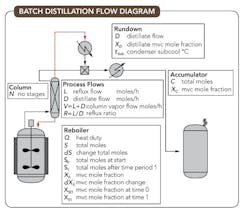
Figure 1. Configuration includes a reboiler, a condenser and an accumulator.
The simplest form of batch distillation involves a single flash separation and is used where a large difference in volatility exists between the components. Such a distillation doesn’t need a fractionating column between the batch still, normally a stirred jacketed reactor, and the condenser. Simple batch distillation, also referred to as pot-to-pot, provides one theoretical plate of separation.
[callToAction ]
Figure 1 depicts a typical batch distillation arrangement utilizing a stirred batch reactor as the reboiler (still), packed column, overhead condenser, rundown cooler and accumulator (receiver), together with nomenclature related to these components.
When the difference in volatility between components is small or when operating over narrow composition ranges, a rectification section is necessary between the still and the condenser. Overhead facilities are required to provide control of reflux ratio and layer separation when handling heterogeneous azeotropes.
In operation, the system is brought to steady state under total reflux. Overheads are continuously withdrawn in accordance with the reflux control strategy. Cuts (fractions) are taken by switching to different accumulators (receivers), following a time, temperature or overhead composition strategy.
Batch distillations can be run several ways:
• maintaining a constant reflux ratio, giving varying overhead composition; (The distillation is continued until the still or distillate receiver achieves the desired composition.)
• varying the reflux ratio, giving constant overhead composition; (As the distillation proceeds, the still is depleted of the lighter component with the reflux ratio continually increasing. The distillation is terminated at a maximum economic reflux ratio, when the desired still composition is achieved or when still heat input can’t sustain the reflux ratio.)
• using repetitive total reflux; (The unit is operated at total reflux until equilibrium is established; then distillate is withdrawn as total drawoff for a short period of time before returning to total reflux. This technique is useful for separating a low-boiling trace component.) or,
• minimizing time by varying reflux ratio. (This provides the most-cost-effective mode of operation consistent with achieving the desired separation.)
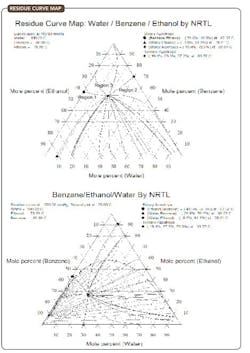
Figure 2. Water/benzene/ethanol system forms several binary azeotropes.
Distillations normally are performed at atmospheric pressure. However, reduced-pressure operation sometimes is required for achieving a desired separation, improving economics by decreasing heat input, or processing temperature-sensitive materials.
Multipurpose operation demands care when selecting column internals to achieve acceptable loadings and operational turndown.
OPERATION AND CONTROL
The mass and energy balances constrain operation and control of a batch distillation [1]. If conditions are fixed at the still, then conditions at the top of the column can be varied and vice versa.
A common strategy is to control the heat input at the still to maximize the distillate draw rate and sustain the desired reflux ratio. The still bottoms temperature will increase as the distillation proceeds, reducing the temperature driving force. If the heating medium is steam, flow rate or pressure can control the heat input; if it’s a heat transfer fluid, increasing its temperature can maintain the heat input. Alternatively if the heating medium conditions are fixed, reducing the distillation pressure will raise the temperature driving force; if necessary, this can be done in incremental steps throughout the distillation.
At constant pressure, the top and bottom temperatures provide an indication of composition. If the product is the still residues, the distillation is continued until the bottom temperature reaches a target limit. If the product is the distillate, the column top is maintained at a targeted temperature by increasing the reflux ratio as the distillation proceeds. At some point the still heat input won’t be able to sustain the increasing reflux ratio, at which point the column top temperature will start to rise and the distillation should be stopped.
The operating instructions can determine the distillation by specifying temperature cutoff values or by providing time steps for an established separation. When carrying out repetitive batch distillations, it may be desirable to shorten the distillation time by using intermediate fractions between the component fractions.
Basic instrumentation and control required includes still-bottoms and column-top temperatures, still pressure (possibly, including its control), reflux and distillate flow control as well as level measurements appropriate for the plant configuration. The heating medium used and jacket configuration will determine still heat input control [2]. To start the distillation, apply heat to the still and continue until stable conditions at total reflux have been achieved. Then begin the distillate draw at fixed reflux ratio for bottoms composition or variable reflux for top composition. Multiple distillate cuts require separate receivers for each.
Don’t store hot liquids, e.g., hydrocarbons, or subcool the reflux because this causes internal reflux that requires additional still heat input; install rundown coolers appropriately.
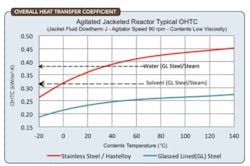
Figure 3. Correlations can provide initial estimates for the still heat duty.
THERMODYNAMICS
The Antoine equation can be used to calculate the vapor pressure and concentrations at temperatures other than a solvent’s atmospheric boiling point [3, 4]:
logp = a – b/(c + t) (1a)
or for natural log:
ln p = ae – be/(ce + T) (1b)
where p is the vapor pressure of the component, mm Hg; t is temperature, °C; T is temperature, K; a, b and c are Antoine coefficients (base 10) for each pure solvent [3]; ae, be and ce are Antoine coefficients (natural) for each pure solvent [per CHEMCAD simulator], where lnp = 2.303 log p.
The coefficients can be converted via:
a = ae/2.303; b = be/2.303; and c = ce – 273.
The Cox equation is an approximation based on Antoine coefficientc being in the 210–250 range. It allows calculation ofa andb from two known points on the vapor-pressure/temperature relationship, and estimation of the relative volatility of an ideal binary mixture throughout the operating temperature range.
log p = a[b/(t +230)] (2)
This allows relating the coefficients to relative volatility:
α = p1/p2(3)
log α = log p1 – log p2 (4)
log α = (a1 – a2) – (b1 – b2)/(t+ 230) (5)
where α is relative volatility based on Raoult’s law, and the subscripts 1 and 2 denote a particular component, with 1 representing the more volatile component (mvc). Note: α increases as the temperature decreases, which is achievable by operating at a reduced pressure.
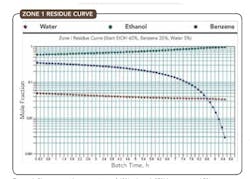
Figure 4. Plot starts with composition of 60% ethanol, 35% benzene and 5% water.
For ternary mixtures in a simple distillation, a plot of liquid compositions on triangular axes is known as a residue curve. The residue curve indicates the locus of the liquid composition remaining behind in the still bottoms during a simple equilibrium distillation process. The residue curve depends upon the starting liquid composition from which a family of curves can be generated to create a residue curve map (RCM), which is used to determine the viability of a distillation; the RCM provides a great amount of insight into the separation of a mixture [4].
All residue curves originate at low-boiling pure components or azeotropic compositions (low-boiling nodes) and end at high-boiling compositions (high-boiling nodes). An RCM with more than one origin for residue curves has more than one distillation region.
Intermediate-boiling pure components and azeotropes that aren’t nodes are called saddles. In a distillation region (three-sided) with one saddle, all residue curves track back toward the solitary saddle. However, in a region with two non-adjacent saddles (four-sided), some residue curves track toward each saddle.
The RCM and mass balance identify feasible operations because the distillate and bottoms will lie on the same residue curve, which must be in the same distillation region. For heterogeneous azeotropes, overlaying the RCM with the liquid/liquid phase equilibrium (binodal) diagram will show valid operating conditions.
Consider the residue curve for water/benzene/ethanol where there are three binary and one ternary minimum-boiling azeotropes (Figure 2). Only one of the binary azeotropes and the ternary azeotrope are heterogeneous. Each pure component is a high-boiling node in one of the three distillation regions, with the ternary being the low-boiling node in all three regions. Pure ethanol is only obtainable within Region 1. Exploiting the liquid/liquid equilibrium (LLE) allows us to cross the distillation boundaries between Regions 1, 2 and 3 to obtain a benzene-rich stream.
A convenient distillate composition in the two-phase LLE region is the ternary azeotrope, being the low-boiling node in all three regions. The organic layer from the ternary azeotrope is in Region 3 and the aqueous layer is in Region 2 — note that mixing the organic layer with the feed can produce a composition in Region 1.
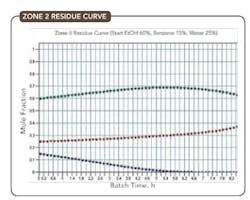
Figure 5. Initial composition is 60% ethanol, 15% benzene and 25% water.
MASS AND ENERGY BALANCES
The primary objective in a batch distillation is to minimize both batch cycle time and heat input by optimizing the number of stages and reflux ratio to achieve the required separation [3, 5]. The process variables are interdependent as determined by the mass and energy balances and the mode of operation.
The reflux ratio
R = L/D (6)
relates to the slope of the operating line,m, via:
m = L/V = R/(R+ 1) (7)
The overall mass balance at the top of the column is:
D/V= 1/(R+ 1) (8)
The mass balance demonstrates that the top composition is established by the D/V ratio, which depends upon the reflux ratio. If the D/V ratio is high, separation will be low and withdrawal of distillate must be stopped while a relatively high value of the mvc mole fraction, XD, remains, i.e., light ends recovery will be poor. If theD/Vratio is reduced to enhance recovery, the distillation may consume an uneconomic amount of time and energy.
A mass balance on the mvc yields the following relationship, known as the Rayleigh equation:
(dS)XC = d(SXS) (9)
ln (S0/S1) = (10)
The overall mass balance for the system gives:
S0 – S1 = C(11)
A mass balance on the mvc yields:
S0XS0 – S1XS1 = CXC (12)
and by transposing:
C/S0 = (XS0 – XS1)/(XC – XS1)(13)
S1 = S0(XS0 – XC)/(XS1 – XC) (14)
The Fenske equation uses a separation factor, F, to establish the minimum number of theoretical stages, NMIN, required at total reflux to achieve a specified separation of a binary mixture with near-ideal behavior:
NMIN ln α = ln F(15)
F = [XD/(1 – XD)][(1 – XS)/XS] (16)
where XD and XS are the mole fractions of the mvc in the distillate and still compositions, respectively, and α is the relative volatility of the two components.
If a given column can achieve the required separation at total reflux, the next step is to determine the minimum reflux ratio, Rmin, using Underwood’s equation for a binary system:
Rmin = [1/(α - 1)][(XD/XS) – α(1 – XD)/(1 – XS)](17)
When the distillate must contain the mvc at high purity, i.e., XD >0.995 mole fraction, Eq. 17 simplifies to:
Rmin = 1/(α - 1)XS(18)
For a high separation factor, a minimum relative volatility of 1.5 is considered reasonable, thus setting a top limit of Rmin at 2/XS. Batch distillations should start with Rmin equal to that required for a continuous split; Rmin increases as the amount of the mvc in the still decreases.
The total reboiler heat input to reduce the reactor contents from S0 to S1 moles for a variable top composition, achieved by setting a fixed reflux ratio, is:
Q = λ(S0 – S1)(R + 1) (19)
where λ is the latent heat of vaporization.
The reboiler heat input for a fixed top composition, achieved by varying the reflux ratio to maintain a fixed top temperature at constant pressure, is:
Q = λ(S0 – S1) (20)
Both relationships indicate that the reflux ratio must be kept to a minimum, subject to satisfying the requirements for the desired separation specification, to minimize the heat input.
The boil-up rate,V, without reflux is:
V = Q/λ (21)
At total reflux, the reboiler heat duty is:
Q = V(λ + Ht (22)
where H is the liquid specific heat andtsub is condenser subcool in °C.
The batch time, θbatch, at constant reflux ratio is given by:
θbatch = [(R +1)/V](S0 – S1) = λ/V (23)
Table 1. Predicting a stirred batch reactor’s inside film coefficient requires three constants.
BATCH STILL HEAT TRANSFER
The boil-up rate achievable with stirred jacketed reactors depends upon many factors, including operational temperature difference, jacket heating media and heat transfer considerations [2, 6].
The fundamental equation for heat transfer is:
Q = UAΔtmean = fjHj(t2 – t1)(24)
where Q is the still heat duty, U is the overall heat transfer coefficient, A is the heat transfer area, Δtmean is the mean temperature difference, fj is jacket fluid flow and Hj is jacket fluid specific heat.
Δtmeanwith a still bottoms temperature tbotand jacket-fluid inlet and outlet temperatures t1 and t2 is approximated by:
Δtmean = (t2 – t1)/2 – tbot(25)
The overall heat transfer coefficient is the sum of the individual resistances, i.e.:
1/U = 1/hi + 1/hfi + 1/(kw/x) + 1/ho + 1/hfo (26)
where hi is the inside film coefficient, hfi is the inside fouling coefficient, kw is the thermal conductivity of the still wall, x is the vessel wall thickness, ho is the outside film coefficient and hfo is the outside fouling coefficient.
For glass-lined equipment, the wall thickness consists of the metal thickness, xm, and the glass thickness, xg. The reactor-wall thermal conductivity includes the contributions of both materials:
kw = (km + xg)/(xg/kg + km/km)(27)
where km and kg are the thermal conductivities of the metal and glass, respectively.
The inside and outside fouling coefficients are determined by practical experience; extensive literature exists on this subject. The combined fouling coefficient is given by:
hf = hfihfo/(hfi + hfo) (28)
The stirred-batch-reactor inside film coefficient can be predicted using the Sieder-Tate equation:
Nu = KRe0.667Prn( μb /μw)q(29)
where Nu is the Nusselt number, Re is the Reynolds number, Pr is the Prandt number, K, n and q are empirical constants provided by the agitator manufacturer, μb is the process-side bulk viscosity and μw is the process-side viscosity at the wall. In low viscosity applications, μb/μw approaches unity and can be ignored.
The Nusselt number is:
Nu = hid/kpf (30)
where d is the reactor inside diameter and kpf is the process fluid thermal conductivity.
The Reynolds number is:
Re = ρrI2/μb (31)
whereρ is the density of the process fluid,r is the impeller rotation rate andI is the impeller diameter.
The Prandtl number is:
Pr = Hpfμb/khf(32)
Table 1 provides some typical agitator constants.
The outside film coefficient depends on the type of heat transfer surface, which can be external jacket(s) with or without spiral baffles or mixing nozzles, external half coil(s) or internal coil(s).
For spiral baffled jackets without mixing nozzles, coils and half coils, under turbulent flow conditions ho is determined via:
Nu = hodequ/khf = 0.027Re0.8Pr0.33(33)
where Re is found using the equivalent diameter, dequ, given by:
dequ = 4s/W (34)
wheres is flow cross-sectional area, andW is the wetted perimeter for heat transfer (which is equal to the spiral baffle pitch or inside pipe diameter for external half-coil construction).
ho is evaluated under actual process conditions in the jacket.
For mixing nozzle applications, manufacturers’ proprietary methods are used to calculateRe, raised to a modified coefficient, depending on turbulent or laminar flow conditions.
The batch still duty is calculated via:
Q = UA(t1 – tbot)(35)
As the distillation proceeds, the still bottoms temperature tbotis increasing and the heat transfer areaA is reducing, so the temperature difference must be raised to maintain an acceptable heat duty and boil-up rate. Figure 3 shows typical heat-transfer coefficients that can serve for initial estimates of the still heat duty.
A heat balance allows prediction of the heat-up and cool-down cycle times:
Q = UA(t1 – tbot) = 60(dt/dθ)(wHstill + MHbot + JHj) (36)
where dt/dθ is the still bottoms temperature change expressed as rate per minute (Q and U units based on hours), w is the still equipment weight, Hstill is the specific heat of the still material of construction, M is the mass of the still bottoms fluid, Hbot is the specific heat of the still bottoms fluid, J is the jacket fluid mass and Hj is the specific heat of the jacket fluid.
The rate of temperature change during heat-up is calculated via:
dt/dθ = Q/[60(wHstill + MHbotj)] (37)
The time θ in minutes for temperature change from t1bot to t2bot can be calculated using mean values for the specific heat andU in the temperature range under consideration:
θ = [(wHstill + MHbot + JHj)/UA] ln (t1 – t1bot)/(t1 – t2bot) (38)
PROCESS SIMULATION
Applying batch distillation simulation software can lead to significant savings in process development and production costs. Achieving a successful simulation requires an understanding of the relevant thermodynamics for the batch distillation process.
As demonstrated, the mass and energy balances control the interdependence of process parameters. Setting one process parameter fixes all dependent parameters; setting two independent process parameters defines the batch distillation operating state.
A sound modelling strategy is to define the still condition by specifying the reboiler duty or boil-up rate to sustain the overhead fixed or variable composition condition specified. As the distillation proceeds and less of the mvc remains in the system, the reboiler duty requirement will increase to sustain the same boil-up rate and satisfy the increasing reflux ratio if operating at constant top composition.
Consider the following when setting up the simulation:
• Distillate temperature, at constant pressure, sets distillate composition.
• At constant boil-up rate, the reflux ratio sets the distillate withdrawal rate.
• The reflux ratio and distillate rate can’t be set independently.
• The reboiler and condenser duties can’t be set independently.
To set the initial conditions, flash the batch charge with a zero vapor fraction at the operating pressure to give the bubble point of the mixture. The first step should start from total reflux to establish equilibrium and a composition profile. All subsequent steps should begin with current column content. The steps can be stopped based on time, temperature, composition, quantity or reflux ratio as required. A simple one-stage batch distillation without rectification is modelled by selecting two stages and a reflux ratio of zero; the reboiler and condenser each represent a stage.
For the desired separation, ensure the number of stages selected satisfies NMIN. For heterogeneous azeotropes, select “total condensation with decant,” which requires specification of the fraction (0.0–1.0) of light phase or heavy phase removed to a decanter and mandates use of the simultaneous correction method.
Figures 4-6 show the residue curves for the ethanol/benzene/water system starting from compositions in each of the three regions and verify the residue curve mapping behavior predicted.
(Note: I used CC-BATCH software by Chemstations to generate the process flow schematic, residue curves, binodal and batch distillation plots.)
GET MORE DETAILS
This article is based on material that appears in “Chemical Engineering in Practice,” 2nd edition. The 550-page book, which also includes a CD covering all the cases discussed, is available from P & I Design, http://pidesign.co.uk/publication.htm or via Amazon.
John Edwards is senior consultant at P & I Design Ltd., Stockton-on-Tees, U.K. E-mail him at [email protected].
REFERENCES
1. U. M. Diwekar, “Batch Distillation: Simulation, Optimal Design, and Control,” 2nd ed., Taylor & Francis, London (2011).
2. J. E. Edwards, “Keep Cool when Designing Batch Reactors,” Chemical Processing, September 2005, www.ChemicalProcessing.com/articles/2005/554/
3. I. Smallwood, “Solvent Recovery Handbook,” 2nd ed., Blackwell, Oxford, U.K. (2002).
4. R. E. Rooks, “Draw Insights on Distillation,” Chemical Processing, May 2006, www.ChemicalProcessing.com/articles/2006/071/
5. F. G. Shinskey, “Process Control Systems: Application, Design and Tuning,” 4th ed., McGraw-Hill, New York City (1996).
6. J. E. Edwards, “Chemical Engineering in Practice,” 2nd ed., P&I Design, Stockton-on-Tees, U.K. (2011) [see sidebar].
NOMENCLATURE
A surface area
a, b, c Antoine coefficients for each pure solvent
C total moles in accumulator
D distillate flow, mole/h
d reactor diameter
F separation factor
f fluid flow
H specific heat of liquid
h film coefficient for heat transfer
I impeller diameter
J jacket fluid mass
K empirical constant
k thermal conductivity
L reflux flow, mole/h
M mass of still bottoms fluid
m slope of operating line
N number of theoretical stages
Nu Nusselt number
n empirical constant
Pr Prandt number
p vapor pressure of component, mm Hg
Q heat duty,
q empirical constant
R reflux ratio
Re Reynolds number
r impeller rotation rate
S total moles in reboiler
s cross-sectional area
t temperature, °C
T temperature, K
U overall heat transfer coefficient
V boil-up rate, moles/h
W wetted perimeter for heat transfer
w still equipment weight
X mole fraction of more volatile component
x material thickness
subscripts
b bulk
bot bottoms fluid
C in accumulator
D in rundown
e natural log
equ equivalent
f fouling
fi inside fouling
fo outside fouling
g glass
hf heat transfer fluid
i inside
j jacket
m metal
mean mean
min minimum
o outside
pf process fluid
S in reboiler
still still material of construction
sub condenser subcool
w wall
1 time 1 or as specified in text
0 time 0 or as specified in text
Greek letters
α relative volatility based on Raoult’s law
θ time
λ latent heat of vaporization
μ viscosity
ρ density

