1310-gc-stands-for-greater-control-ts

GC Stands For Greater Control

Oct. 8, 2013
Smaller instruments, faster analyses and smarter software will extend gas chromatography's role.

Chemical companies are striving for more complete and reliable process control information to tighten adherence to product specifications, reduce waste and identify areas ripe for process improvement. This is spurring a drive to build more capable and agile process instrumentation and, with it, recasting the role of instrumentation in production.

The last ten years have seen a flurry of development activity — much of it driven directly or indirectly by the New Sampling/Sensor Initiative (NeSSI), a 15-year-old effort sponsored by the Center for Process Analysis and Control (CPAC) at the University of Washington, Seattle. NeSSI was born with the mission to standardize and miniaturize sampling systems to make them less expensive to deploy and able to fit in more-space-restrictive environments. This brings the instrument systems closer to the process by minimizing distance between analyzer and process. In turn, making the instruments faster markedly improves the potential of a timely response.

SMALLER IS BETTER

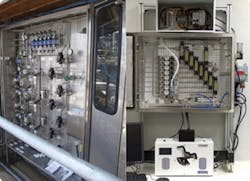
Figure 1. Conventional sampling system (left) commands 10 times the floor space and 100 times the volume of compact NeSSI assembly. Sources: Exxon, Amyris.

Instruments don't provide control information directly, though. An interpretation step is necessary to achieve the control benefit. However, a decreasing number of skilled analysts are available to convert the data into useable information. So, software has to be made smarter. Fortunately, techniques from the world of chemometrics can add to system intelligence.SHRINKING THE SAMPLING SYSTEMWhen we decide to place an instrument on-line, there has to be a connection to the process. The total cost of ownership of any analyzer is tied to the complexity of the application and the engineering effort to plumb the system into the line. Installation and maintenance often exceed the purchase price of the instrument. Various reports, e.g., Reference 1, document that the NeSSI platform reduces lifetime costs by as much as 40%. With the miniaturization and the cost advantage in place, we can look toward putting instrumented systems in locations where previously no logistical or economic driver existed.We can see the advantage of standardization and small size represented by NeSSI by comparing two recent installations (Figure 1). The system on the left is a conventional plumbing project designed to handle six streams and feed into a near-line gas chromatograph. On the right is an eight-stream system executed in the NeSSI manner. It's clear that the compact nature of NeSSI enables instrument placements that would be too unwieldy in larger format.So now, where we only might have considered installing one or two simple probes (e.g., for pressure or temperature), we can look toward a more-data-rich source with which to characterize the process at this sampling point — if we take advantage of the capabilities.We also must move beyond the simple measurements of temperature, pressure, flow and level. These parameters simply don't offer enough information content to monitor effectively the chemistry differences we expect. Optical spectroscopy allows us to differentiate analytes based on functional groups (aromatic versus aliphatic versus olefinic, etc.), which ties to many critical physical properties. Chromatography, especially gas chromatography (GC), is perfect for separating complex mixtures and characterizing their population based on molecular weight.
COMPACT CHROMATOGRAPHS

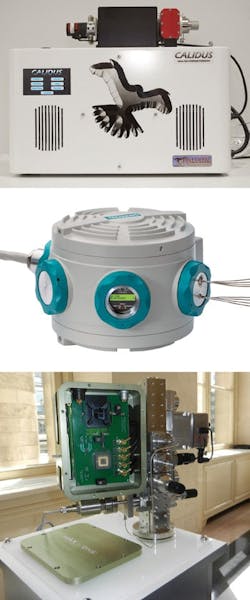
Figure 2. Small-format gas chromatographs now are available from a number of vendors. Sources: APIX, Falcon, Siemens.

Remember that one of our purposes in placing the NeSSI components on-line is to improve response time. Spectroscopy already is faster than most process control systems are set to react, but GC historically has been much slower. So, we'll focus on how the interplay between NeSSI and gas chromatography is helping address this issue.REFINING GAS CHROMATOGRAPHYOver the last ten years, a substantial effort has focused on making on-line GC more responsive to the control world. Throughout, the goals have been to:• speed the response time;• reduce an on-line chromatograph's footprint; and• better utilize computational advances to extract the information content of the data stream.Ultimately, we want to turn a process GC into an appliance. As we work to attain this goal, some fundamental changes are needed both in our approach to hardware and the scope of the software.With the advent of NeSSI fluid handling and a standardization of the sampling approach to the process stream, the trend clearly is toward making the instrument smaller as well. Today, a number of compact and even micro GCs are available (Figure 2).Some portions of a gas chromatograph are amenable to shrinkage but, ultimately, there's a tradeoff between the number of applications that can be handled and the system dimensions. So, we need to adopt a Goldilocks approach — i.e., selecting an instrument that's just right. With the advent of direct on-column heating, we can eliminate the largest source of power consumption and weight, the chromatographic oven. This excises well over half the weight and 75% of the size. Also, by removing the oven from the design, we gain flexibility in analyzer placement. We often can get away with abandoning an air-conditioned near-line structure in favor of a simple sun- and-rain shield, allowing system positioning much closer to the sampling point. Ultimately, this oven-free approach simplifies maintenance requirements because we need to tend shorter supply lines. Then, by requiring the system to be a series of plug-and-play modules, we turn the maintenance visit into one measured in times of five minutes or less rather than hours.
ALIGNMENT VARIABILITY

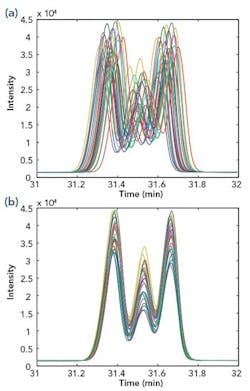
Figure 3. Over a 5-yr period, six different GCs produced these raw chromatograms (a) but software gave aligned chromatograms (b). Source: Chevron ETC.

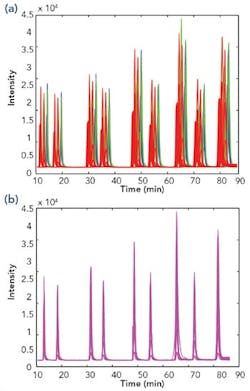
Hydrogen carrier gas and short, high-resolution capillary columns cut the time of analysis, while detection system options (flame ionization for hydrocarbons, thermal conductivity for atmospheric components, flame photometric for sulfur compounds, and halogen-specific for environmentally significant components), coupled with NeSSI-smart valve injection, give us an extremely flexible base for analyzing nearly anything on-line in real time.The smaller form factor, better speed and lower maintenance demands show how the NeSSI concept has migrated to the instrument side to give us the fundamental basis for true control of a process. Now, let's turn our attention to software developments that NeSSI is fostering.ELIMINATING RETENTION TIME VARIABILITYA series of chromatograms will clearly show that retention times change as a function of time. This is even more evident when comparing instrument to instrument or before and after column maintenance (Figure 3a).It's not practical in a process setting to manually manipulate the chromatographic conditions to keep retention times constant. This leads to the first role for software: to adjust for retention time drift. A number of software techniques can address the problem; all use a multivariate correlation algorithm to bring the retention times under sufficient control, even when matching results from more than one chromatograph.Figure 3b shows that such software, in this case LineUp, allows us to generate consistent run-to-run results for more than one chromatograph and over a long period of time. This capability can impact maintenance — by reducing the time spent on instrument calibration. For instance, taking three similar chromatographs (same nominal method, column and detectors) fresh off the production line and applying the alignment technology, we should be able to superimpose the results, as shown in Figure 4.With alignment technology bundled into the method, the GC will generate very consistent results as long as mechanical problems, column degradation or a process upset don't intervene. So, we can get accurate, representative results every time, even if we must change a column, a detector or even an entire instrument. We also can monitor how hard the software must work to keep retention time under control — affording us a mechanism to predict and prioritize when a hardware problem must be addressed.
MULTIPLE INSTRUMENT ALIGNMENT

Figure 4. Before (a) and after (b) results show the impact of alignment software on three similar new GCs.

The effect on maintenance efficiency is clear. Industry analyses, e.g., Reference 2, indicate that a vast majority of trips to the analyzer location prove unnecessary and that the most common culprit in chromatographic instrumentation is the lack of retention time fidelity. Intelligent deployment of software not only eliminates the unneeded callouts but also frees the system to identify true problems with a significantly higher success rate.The NeSSI concept strikes again, giving us true plug-and-play (not plug and work hard to recalibrate) capabilities. This leads to the second role of software: dealing with the flood of data.AUTOMATING DATA INTERPRETATIONWith our fast GC appliance in place, we approach the speed of spectroscopy in generating multivariable data streams. With retention time alignment in place, we can use the same software that we rely on in spectroscopy to interpret the GC trace.While chromatographic data are complex and multivariate, most process monitoring and control strategies are fairly simple and often can be expressed in binary terms (i.e., good/bad, steady state/upset, consistent/changing, etc.). Therefore, the goal is to interpret either the raw chromatographic data or the tabular results into a few important quality parameters. This is done with classification or regression models.
DETAILED HYDROCARBON ANALYSIS

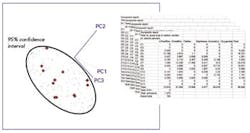
Figure 5. Tried-and-true multivariate analysis assessed a series of detailed reports on winter-grade gasoline.

Figure 5 shows an automated interpretation, via Pirouette software, of detailed hydrocarbon analysis (DHA) of winter-grade gasoline, to see if it falls within the acceptable envelope for release. The DHA table generates a matrix separating hydrocarbons both by carbon number and compound type. A chemometric analysis maps a point that scores every run and compares it to a library. Here, a single point represents each chromatogram; points close to one another are relatively similar. This approach allows us to create a confidence limit around, in this case, "good winter-grade gasoline" and instantly detect if a sample is out-of-specification. USING A GC FOR CONTROLAs NeSSI-inspired sampling systems become more common, the attention is shifting toward building hardware and software that better suits the innovations in sample handling. The hardware is getting smaller, faster and easier to configure to handle an application's specific requirements. With alignment in place, it's practical to compare chromatograms from any instrument as long as they're running substantially the same method and use similar columns and conditions. Even historical data can be retrieved and brought into alignment with a more modern gold standard. Using the exact same chemometric approach we use in optical spectroscopy, we can build robust, fully automated interpretation systems to give us the final link to bringing GC truly into the control loop.


BRIAN G. ROHRBACK is president of Infometrix, Inc., Bothell WA. E-mail him at [email protected].

REFERENCES
1.    Dye, T., "Update of NeSSI Market Status and SMART Module (SAM)," CPAC, Univ. of Washington, Seattle (May, 2010), http://depts.washington.edu/cpac/Activities/Meetings/Spring/2010/agenda.html
2.    Gunnell, J., "History and Overview of NeSSI," CPAC, Univ. of Washington, Seattle (November, 2008), http://depts.washington.edu/cpac/Activities/Meetings/Fall/2008/agenda.html
3.    Chrisensen, J. H., Tomasi, G. and Hansen A.B., "Chemical Fingerprinting of Petroleum Biomarkers using Time Warping and PCA," Environ. Sci. Technol., 39, p. 255 (2005).
4.    Dubois, R. N., van Vuuren, P. and Gunnell, J. J., "NeSSI (New Sampling/Sensor Initiative) Generation II Specification," CPAC, Univ. of Washington, Seattle (2003).
5.    Dubois, R. N., Novak, D. and van Vuuren, P., "Process Analytics: are there dinosaurs among us?", CPAC, Univ. of Washington, Seattle (November, 2010), http://depts.washington.edu/cpac/Activities/Meetings/Fall/2010/documents/DuboisetalCPACdinosaursNov2b2010.pdf
6.    "New Sampling/Sensor Initiative," http://cpac.apl.washington.edu/story/NeSSI%E2%84%A2
7.    "Process Analytical Systems: A Vision For The Future," http://depts.washington.edu/cpac/NeSSI/2_IFPAC_2000/VisionPaper_IFPAC2000.doc
8.    Rechsteiner, C. A., Jr., Ramos, L. S., Rohrback, B. G. and Crandall, J. A., "Towards a More Robust Process GC," Proceedings of the Instrument Society of America — 53rd Analysis Division Symposium, Session 4, Paper 2, ISA, Research Triangle Park, NC (April 2008).

Sponsored Recommendations

Heat Recovery: Turning Air Compressors into an Energy Source

More than just providing plant air, they're also a useful source of heat, energy savings, and sustainable operations.

Controls for Industrial Compressed Air Systems

Master controllers leverage the advantages of each type of compressor control and take air system operations and efficiency to new heights.

Discover Your Savings Potential with the Kaeser Toolbox

Discover your compressed air station savings potential today with our toolbox full of calculators that will help you determine how you can optimize your system!

The Art of Dryer Sizing

Read how to size compressed air dryers with these tips and simple calculations and correction factors from air system specialists.