The level in a process vessel often isn't viewed as a critical variable to control. Especially in surge vessels, controller performance typically is considered satisfactory if no high- or low-level trips occur. Vessel level's effect on the corporate bottom line usually is nil. So, it's easy to see why vessel level controls receive little attention.
However, neglecting level control carries definite risks. Indeed, loss of level control has contributed to three major industrial accidents (see: "Don't Underestimate Overfilling's Risks").
Processes consist of a collection of unit operations. The various flow streams that interconnect these unit operations propagate variance from one to the next. This variance ideally should diminish as it spreads but the nature of some unit operations actually amplifies it.
Control loops also can amplify variance, either through improper operating objectives or poor tuning. The flow between some unit operations depends upon a level controller's output to a final control element on a flow stream. Two factors make level loops a potential source of variance:
- Variance in any stream in or out of a unit operation leads to variance in vessel level, to which the level controller responds by changing the flow of either an inlet or a discharge stream.
- The inherent nature of level processes complicates controller tuning, especially for integral or reset mode. Excessive reset action (i.e., reset time too short or reset rate too fast) results in a cycle in the flow. In the conservatively tuned level loops applied to surge vessels, the slowly responding controller produces a cycle with a period of hours. This is where level differs from other loops — reducing the controller gain or sensitivity doesn't eliminate the cycle but merely increases its period.
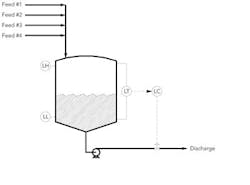
Figure 1 shows a vessel with four feed streams and one product stream. The level controller influences just the discharge stream. The only difference between controlling using a feed stream instead of a discharge stream is directionality (increase-increase versus increase-decrease). In Figure 1 the final control element is a valve but a pump with a variable frequency drive often is a viable, and possibly preferable, alternative.
The controller in Figure 1 translates variations in vessel level to variations in discharge valve opening and, hence, discharge flow. Maintaining level within a given proximity to its set point requires certain changes in discharge flow. Generally, the tighter the level is controlled, the larger the necessary variations in discharge flow.
Now, let's consider some characteristics of a feedback controller:
- It decreases the variance in the control error by increasing the variance in the controller output, which translates to higher variance in the flow through the final control element.
- It shifts variance from one variable to another; it doesn't reduce total variance.
- An improperly tuned feedback controller can significantly raise total variance.
Although instrument technicians often are responsible for tuning level controllers in a plant, propagation of variance is a process issue that's most appropriately addressed by process engineers.
INTEGRATING PROCESSES
Most level processes are integrating/ramp/non-self-regulated, the primary exception being gravity flow applications. When the level controller is on manual, with an integrating process:
- Vessel level changes at a rate proportional to the imbalance in the material balance (total flow in minus total flow out).
- Changes in level (and, thus, head) don't affect the discharge flow and, consequently, the imbalance in the material balance.
- The rate of change in level remains the same as the level increases or decreases.
When the level doesn't directly impact any flow in or out, the dynamic characteristics of the process act as an integrator. The integrator in the reset mode of a controller coupled with an integrator in the process can have adverse consequences.
Starting from an equilibrium state (total flow in equals total flow out), any upset results in a ramp change in level, hence the term "ramp process." If the upset conditions persist, the ramp continues until the level reaches a limiting condition, usually in the form of a high- or low-level process trip. When no control actions are taken, such processes don't seek an equilibrium, hence the term "non-self-regulated process."
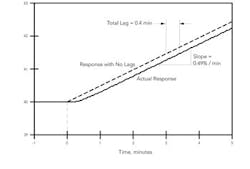
Figure 2 illustrates the response in level to an upset to the material balance. When the material balance is closed (imbalance is zero), vessel level is constant. In Figure 2, this is the case prior to time 0. At that point the discharge valve opening is reduced by 10%, which decreases discharge flow and causes level to increase.
All examples we'll discuss pertain to a straight-walled vessel containing a constant density liquid, hence the ramp has a constant slope as in Figure 2. We'll express the level as a percentage of the level measurement span. The response in Figure 2 is for a 12,000-L vessel. The average flow through the vessel is 200 L/min, giving a residence time of 60 min or 1 hr.
A simple characterization of a level process relies on two parameters whose value can be readily obtained from the response in Figure 2:
Process gain, KF. This is the effect of a 10% change in the controller output on the slope of the ramp. From Figure 2, a 10% reduction in the controller output causes the slope of the ramp to change from zero to 0.49%/min. So:
KF = (0.49 %/min)/10% = 0.049 (%/min)/%
A decrease leads to an increase in level, so the process is reverse acting.
Process lag, θ. The material balance suggests the ramp should commence immediately, as indicated by the dashed line in Figure 2. Instead, the slope changes gradually from zero to 0.49 %/min. By the time the slope reaches 0.49 %/min, the actual response lags by 0.4 min.
The process lag shown by the ramp in Figure 2 includes the following:
Control valve lag. A digital system can change its output by 10% very quickly but all final control elements exhibit some lag in responding to a change in their input signal. Rarely are the response characteristics of the final control element well known.
Measurement device lag. This depends on the measurement technology employed and, sometimes, on how the device is installed. Rarely is this lag quantified.
Smoothing of the process variable. When smoothing is applied either within the measurement device or the control system, quantitative values are available. However, with some level measurement technologies, smoothing can be applied externally.
The lag observed in Figure 2 is roughly the sum of these lags. The combined effect often is approximated by a transportation lag or dead time. In the simple approximations of the dynamics of a level process, the process lag θ is considered to be entirely transportation lag.
Unfortunately, for many level loops, conducting a test such as in Figure 2 is impractical due to the presence of noise on the measured level value and variability in the feed flow to the vessel.
Testing procedures are available to determine KF and θ in face of both measurement noise and flow upsets. One approach is to use a pseudo-random binary signal (PRBS) for the output to the control element. Model predictive control technology relies on such tests to find process characteristics. However, such tests are long-duration (days) and difficult to justify for level control applications.
TUNING EQUATIONS
When a proportional-integral (PI) controller is used, the relationships between the tuning coefficients and the process characteristics are:
Controller gain, KC: inversely proportional to the process gain KF; inversely proportional to the lag θ.
Reset time, TI: not affected by KF; directly proportional to θ.
Especially for large tanks with long residence times, tuning equations often suggest unreasonably large values for KC. Most tuning relationships link the product KFKC (the loop gain) to the process dynamics. The large value for KC results from two factors:
1. For responsive processes, the tuning equations suggest a large value for KFKC. For a vessel with a residence time of 1 hr, a lag of 0.4 min is trivial.
2. For large vessels, the process sensitivity KF is small.
Using the Ziegler-Nichols tuning equations, the suggested values for the tuning coefficients are:
KC= 1/(KF θ) = 0.9/{[0.049 (%/min)/%] × (0.4 min)} = 46 %/%
TI= 3.33 θ = 3.33 × (0.4 min) = 1.33 min
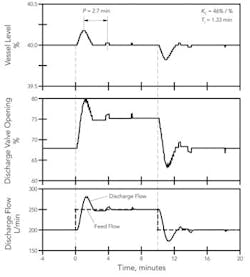
The performance objective for the Ziegler-Nichols tuning equations is a response with a quarter decay ratio, which usually provides a rapid response to a disturbance. Figure 3 presents the response to a 10-min 50-L/min increase in one feed for the level process in Figure 1. These tuning coefficients maintain the vessel level very close to its set point — the maximum level deviation is approximately 0.2%. The response period, P, is 2.7 min. Also note the feed flow change is translated quickly into a discharge flow change.
A controller gain of 46 %/% is unreasonable in a level controller. A high controller gain amplifies any loop imperfections, such as the consequences of a finite resolution in the measured variable. In the example here the measured level value has resolution of 1 part in 4,000 — this means that 0.025% is the smallest possible change in measured level value. Using a controller gain of 46 %/%, a change of 0.025% in vessel level alters the controller output by (0.025%) × (46 %/%) = 1.15%. This, not surprisingly, leads to the abrupt changes seen in Figure 3, especially as the vessel level approaches its set point. Between the abrupt changes, the controller output exhibits ramp changes. (The finite resolution gives a constant control error that is integrated by the reset mode.)
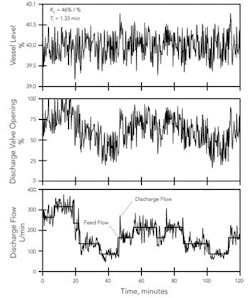
Figure 4 presents the performance of the level controller with 0.5% noise on the level measurement and a varying feed rate. With the high gain, level is maintained close to its target. In addition, feed flow changes are translated quickly to discharge flow changes (which isn't necessarily beneficial). This comes at the expense of noticeable variability in the discharge valve opening and discharge flow. (The aggressive controller is amplifying the noise in the vessel level.)
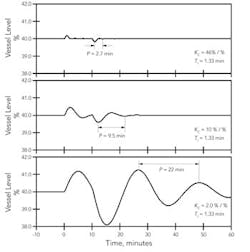
Figure 5. As gain decreases, vessel level fluctuates more widely.
Click on image to enlarge.
When a controller is too aggressive, the customary practice is to reduce KC. Figure 5 illustrates the effect on loop performance of decreasing the controller gain from 46 % to 10 % and finally to 2 %. The conventional wisdom is that reducing the controller gain has two effects:
- The loop responds more slowly. This is clearly the case in Figure 5, with the period increasing from 2.7 min to 9.5 min and finally to 22 min.
- Any oscillations in the response decay more rapidly. However, this isn't the case in Figure 5. For a gain of 46 %/%, the second peak in the oscillation is barely visible. For a gain of 10 %/%, the second peak is still very small compared to the first one. But for a gain of 2 %/%, the decay ratio is approximately 0.5.
With regard to the effect of the controller gain on the degree of oscillations, loops for integrating or non-self-regulated processes behave differently, especially at low KC values. The loop contains two integrators, one in the process and one in the controller. Consider the following possibility:
• Process dynamics consist of only an integrator (no lag, θ = 0).
• Controller is integral-only.When disturbed, the loop responds with a cycle of constant amplitude. Decreasing the controller gain increases the period of the cycle and its amplitude but the cycle neither grows nor decays. Any additional dynamics in the process (such as the lag exhibited in Figure 2) result in an unstable loop for all values of KC.
For a PI controller and an integrating process, the following two observations apply:
1. At low KCvalues, loop behavior approaches that of a loop with an integral-only controller. The cycles in the response have a long period and decay slowly.
2. If the reset time is less than θ, the loop is unstable for all values of KC.
For PI control of an integrating process, continuing to reduce the controller gain results in a slowly decaying cycle with a very long period. Figure 5 clearly illustrates this behavior.
However, in practice, responses such as those in Figure 5 often are impractical to obtain for a level loop. With noise in the measured variable and frequent changes in flows in or out, the situation in Figure 4 is more typical of most level processes. The next article in this series will examine assessing the performance of the level controller when such factors are present.
CECIL L. SMITH is president of Cecil L. Smith, Inc., Baton Rouge, La. E-mail him at [email protected]. This article is based on concepts from his book "Practical Process Control," published by John Wiley & Sons.

