Vacuum technologists and process engineers typically define vacuum conditions differently. The rule of thumb for process engineers is that operations down to roughly 40 mm Hg pressure are "high vacuum pressures," ones down to 5–10 mm Hg are "medium vacuum pressures," and those below 5 mm Hg are "low vacuum pressures." These ranges are set by the effect of cooling water temperatures on the design of the commonly used steam jet ejector and liquid-ring pump vacuum systems.
[pullquote]In contrast, vacuum technologists often use definitions based on the flow behavior of the system. "High pressure vacuum" systems operate where flow is in the viscous region. "Medium pressure vacuum" covers pressures in a transition region. "Low pressure vacuum" involves flow in the molecular region.
For normal flow we experience, molecule/molecule collisions dominate the flow pattern. This is the viscous flow region, which includes both turbulent and laminar flow. We use Reynolds number, NRe, to characterize flow: laminar flow occurs at NRe less than 2,000, transition flow at NRe between 2,000 and 4,000, and turbulent flow at NRe greater than 4,000.
For a gas, as pressure falls, density drops. Decreasing density increases the distance between molecules. Greater spacing raises the mean free path a molecule moves before a molecule-to-molecule collision occurs. Based on ideal gas behavior and spherical molecules, the mean free path length can be determined from:
λ = kBT/2½;πσ2P (1)
where λ is the mean free path length, kB is the Boltzmann constant (1.3806 × 10⁻²³ m2 kg s-2 K-1), T is temperature, σ is the effective hard-shell diameter of the molecule, and P is the pressure. The ratio of λ to the characteristic length, Lc, is called the Knudsen number, NKn. When it approaches 1, molecule-to-surface interactions determine system pressure drop. In such cases, pressure drops significantly will exceed those predicted by conventional flow calculations.
A commonly used reference (Myerson, E. B., "Empty Your Head of Misconceptions about Vacuum Systems," p. 50, CEP, July 1996) states that alternative calculation methods are needed from around 25 torr (start of transition region) and are really important below 10 torr.
A recent project provided insights about calculating such pressure drops. It involved altering operation of a wiped-film evaporator and its de-entrainment system to 4 torr from 10 torr. Estimating the change in system capacity required checking pressure drops from the evaporator inlet to the vacuum pump suction.
For the molecular-flow regime, the correct pressure-drop calculation uses formulas derived from a conductance analogy. The conductance of a flow component is defined as the throughput (power) divided by the pressure drop:
C = Q/(P1 – P2) (2)
The effective conductance for components in series is:
1/CTotal = 1/C1 + 1/C2 + …1/CFinal (3)
and for those in parallel:
CTotal = C1 + C2 + …CFinal (4)
Standard conductance formulas are:
apperture (orifice), C = 38.3A(T/M)½ (5)
long pipe (cylindrical), C = 3.34(d3/L)(T/M)½ (6)
short pipe (cylindrical, with end correction),
C = 38.3d3(T/M)½/(L + d/9) (7)
and duct (rectangular),
C = 89.6a2b2(T/M)½/[(a + b)l + 8ab/3] (8)
where C is in acfm, A is cross sectional area for flow in square inches, T is temperature in R, M is molecular weight, d is pipe internal diameter in inches, L is pipe length in feet, l is duct length in inches, and a and b are duct dimensions in inches. Conductance numbers for many other shapes can be derived or determined from accurate operating data.
Calculated results for the wiped-film evaporator at the new operating conditions posed a problem. They significantly disagreed with projections made from operating data on a different wiped-film evaporator already operating at the lower pressure. Double-checking the data showed no obvious sources of error.
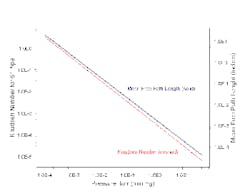
The majority of the system load appeared to come from air leakage. We plotted mean free path lengths against pressure for 60°F air (Figure 1), and estimated 0.37 nm as the hard-shell diameter for an "air" molecule. Figure 1 also includes calculated NKn values for a 6-in. pipe. The characteristic length is the pipe diameter for this case. Accepted practice has molecular flow at NKn values greater than 1.0, transition flow for NKn between 1.0 and 0.01, and viscous flow for NKn less than 0.01.
Figure 1 shows that NKn rises above 0.01 when pressure drops to 0.03 torr. The accepted flow regime moves from viscous to transition at that point. Pressure must drop to nearly 0.0003 torr to fully enter molecular flow (NKn ~ 1). These pressures are far lower than those quoted by Myerson.
Back-checking to Myerson's quoted source (Ryan, J. L. and D. L. Roper, "Process Vacuum System Design and Operation," McGraw-Hill, 1986) for the boundary for the viscous-to-molecular flow transition shows values of 30 microns of pressure for the end of the viscous flow regime and 0.3 microns for the start of the full molecular flow regime in a 6-in. pipe. These numbers nearly exactly match Figure 1. Ryan's and Roper's numbers make sense. So what's wrong?
The numbers quoted by Myerson have one unstated assumption — they are for a roughly 1-in. pipe. They also have one error — the values for the transition boundary "rule-of-thumb" are given in torr but should have been in microns (1 torr = 1,000 microns). As far as can be found, this is the first report of that error.
Using the conductance method when it doesn't fully apply has serious consequences. It leads to pipes and ducts that are far too large and capacity estimates that are far too low. It also undermines troubleshooting by indicating the system is working well (no fouling or blockages) or vacuum loads are much lower than expected.
We can draw a couple of lessons from this. First, just because something is published doesn't mean it's right. Double-check calculation results against well understood data. Second, don't ignore differences between data and calculated values. Figure out what's going on. Doing both will help you get the right answers.
ANDREW SLOLEY is a Contributing Editor to Chemical Processing. You can e-mail him at [email protected].


