Separation Technology: Draw Insights on Distillation
Residue curve mapping is a powerful tool to better understand the design and operation of distillation columns, especially when the mixture is azeotropic [1]. A previous article in Chemical Processing [2] introduced the approach and focused on the feasibility of applications involving mixtures that form two liquid phases. That article showed how to exploit two-liquid-phase behavior to facilitate a desired separation. This article will describe using residue curve maps to check the feasibility of separation of homogeneous mixtures and for developing the conceptual design of towers.
A standard residue curve map is a composition plot of the kettle residue liquid as the mixture is continually boiled with no reflux. As you can imagine, the mixture will get heavier over time, as the lighter components are boiled off. This is important because residue curve maps are an approximation to the liquid composition profile in a distillation column operated at total reflux.
Key advantages
Residue curves can be used to determine what separations are possible with a distillation column independent of how many stages are required and how much energy is consumed. Moreover, compared to stage-to-stage column-composition-profile calculations, residue curves are mathematically much easier to work with and can provide a great amount of insight into the separation of a mixture.
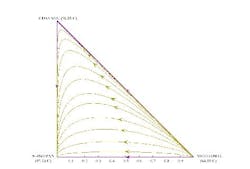
For instance, consider the mixture of methanol, ethanol and n-propanol. This mixture does not form azeotropes and is reasonably ideal. The residue curves for the mixture (Figure 1) have two endpoints: one at the methanol vertex and the other at the n-propanol vertex. If you picked any point along a residue curve as an initial composition for the boiling kettle, then, as the lighter material is boiled off, the kettle composition would stay on the same curve and eventually converge on the n-propanol vertex.
Figure 1. Separation of a mixture of methanol, ethanol and 1-propanol follows the appropriate residue curve. (Click to enlarge)
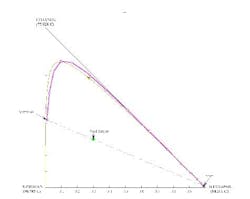
A stage-to-stage composition map for a column operated at total reflux (Figure 2) has 16 equilibrium stages to produce the indicated bottoms and distillate compositions from the feed. A residue curve passing through one of the equilibrium stages is also shown; it closely resembles the column liquid-composition profile. Generally, as the mixture becomes more difficult to separate, these curves will be more similar.
Figure 2. Producing the overhead and bottoms products indicated requires sixteen equilibrium stages. (Click to enlarge)
Also notice that the feed, distillate and bottoms compositions are all on a line. This is required via mass balance for a single-feed, two-product column. From a mass balance, we know that:
where D is the distillate flow, B is the bottoms flow, ziFis the feed (mass or mole) fraction, ziB is the bottoms fraction and ziD is the distillate fraction of a given component in the mixture. This equation provides the co-linear relationship previously described and also is an excellent way to check mass balances from plant samples. Plugging into the equation the results of a feed, distillate and bottoms composition analysis for every component in the mixture should result in the same D/B ratio. This equation also can be used to verify the results of flow meters.
A column mass balance and residue curve maps can significantly help determine what separations are possible. For example, consider a mixture of acetone, isopropanol and water. This mixture forms a single homogeneous azeotrope between isopropanol and water.
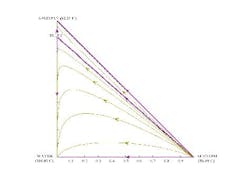
The residue curve map for this mixture shows all of the curves starting at acetone but some ending at isopropanol and some at water (Figure 3). So, depending on the initial starting concentration in the pot, the last drop of liquid in the kettle will be water or isopropanol. This is the effect of the azeotrope between water and isopropanol. The mixture is split into two zones or distillation regions by a curve between acetone and the isopropanol/water azeotrope. This curve is termed a distillation boundary as it separates the two distillation regions. The distillation boundary indicates that if the feed composition to the column is in one distillation region, then a column operating at total reflux would be unable to separate the mixture into the three distinct compounds. It also shows that water, although a potential pure product from a mixture lying in the lower region, cannot be completely recovered from isopropanol and acetone.
Figure 3. Acetone/isopropanol/water mixture can form an isopropanol/water azeotrope. (Click to enlarge)
Column at less-than-total reflux
Engineers use the well-known McCabe-Thiele diagram to evaluate distillation designs for mixtures with two key components when the feed composition, feed quality (liquid, vapor, degree of superheat, etc.) and desired product compositions are known. Stepping off stages between the operating line and the equilibrium curve gives the number of equilibrium stages necessary. Contrast this to how simulations are performed in a standard process simulator: the number of stages is guessed and the column compositions are iteratively solved and the stage count updated until the desired solution is found. McCabe-Thiele diagrams are particularly useful because they provide instant visual feedback you can quickly determine if the reflux ratio is too low, if a pinch-point arises or if there is an infeasible set of specifications due to the presence of an azeotrope.
The operating curves (lines) for a McCabe-Thiele diagram come from mass and energy balances around the column. If you assume a constant molar overflow (meaning that heat effects arent large), the molar vapor rate in the column is constant, except for what is added in the feed. This then allows the operating curves to be straight.
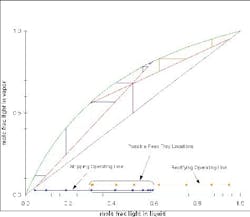
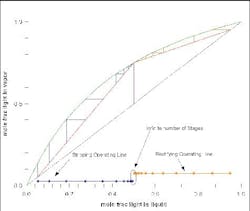
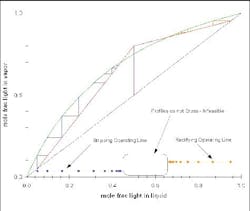
Figure 4 shows a McCabe-Thiele diagram for an ideal mixture. At a feasible reflux ratio, the two operating lines cross. If you project the lines to the x-axis, then, when these two projections overlap, there is a feasible design. The part of the rectifying operating line (orange) and of the stripping operating line (red) beyond where they overlap are ignored, and you can count the number of equilibrium stages required for the separation. If the reflux ratio is changed, then the whole graph can be re-computed. At minimum reflux (Figure 5) and less-than-minimum reflux (Figure 6), the profiles either just touch or do not touch at all.
Figure 4. Several feed-tray locations are possible for this separation of an ideal mixture. (Click to enlarge)
Figure 5. At minimum reflux, separation would require an infinite number of stages. (Click to enlarge)
Figure 6. Diagram clearly indicates that this particular separation is not feasible. (Click to enlarge)
This can be extended to three-component systems (and, with some additional thought, to four and more components), where just the projected operating lines are plotted. Of course, instead of being merely straight lines, they are now curves in two dimensions due to the extra components. The approach, however, is the same (using a conceptual design tool, such as Aspen Split):
- Determine the feed composition (We will assume a saturated liquid feed).
- Start by picking two fractions (mole or mass) in the distillate or bottoms products.
- Choose one fraction in the bottoms or distillate product (This uses up the degrees of freedom on the mass balance).
- Compute concentrations of the other components from the information in No. 1, No. 2 and No. 3.
- Select a reflux or reboil ratio.
- Compute the rectifying and stripping operating lines.
- Locate the feed stage. If the operating lines cross, then the feed stage is at their intersection; the number of stages then can be counted above and below the feed stage. If they do not cross, look at how the curves traverse the composition space and then change the reflux ratio or product specifications to allow the curves to cross.
Applying the design technique
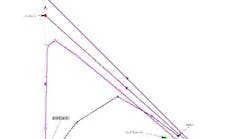
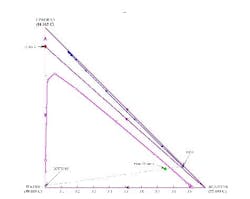
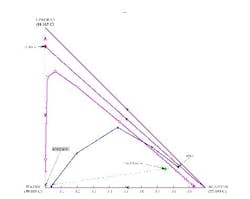
For the acetone/isopropanol/water example (Figure 7), a distillation boundary caused by the water/isopropanol azeotrope separates the water from isopropanol. Like most azeotropes, this one is minimum boiling. Lets apply the above design technique to this mixture.
Figure 7. Separation is not possible if the overhead contains only a small amount of water. (Click to enlarge)
Assume that we have a feed composition representing the outlet of an equilibrium reactor dehydrogenating an azeotropic mixture of water and isopropanol to make a mixture of water/acetone/isopropanol (and hydrogen). The feed to the distillation column is 75% acetone, 11.8% isopropanol and 13.2% water. We wish to remove the product acetone and some of the water introduced in the feed, to prevent accumulation in the process. The isopropanol will be recycled to the reactor.
Because there is no azeotrope between acetone and isopropanol, you might be tempted to opt for a direct split to remove water as the bottoms stream in a first distillation column, with the acetone and isopropanol separated in a second column. However, a residue curve map analysis will quickly show that the distillation boundary between acetone and the isopropanol/water azeotrope prohibits this separation.
A stage-to-stage calculation can be performed as previously described. We specify relatively pure water in the bottoms product and, using a mass balance, a small amount of water in the distillate. We also set the reflux ratio at a value of 3. The stage-to-stage calculations for these specifications appear in Figure 7. Notice how the operating lines (blue and magenta) do not cross. This indicates an infeasible separation.
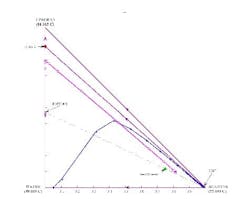
If the distillate composition is changed to allow more water to go overhead (thus putting the distillate composition in the same distillation region as the feed and the bottoms product), we can repeat the calculations to show that the operating lines do cross (Figure 8). This indicates a feasible separation; there are 7.9 stages with the feed at stage 2.3.
Another possibility is to instead remove acetone as a pure distillate product and generate an acetone-free bottoms product (Figure 9). Water can then be taken out in a second distillation column and the isopropanol/water azeotrope recycled back to the reactor.
Valuable visualization
Residue curve maps can help you quickly determine what feed splits that distillation can perform. The technique of specifying product compositions and calculating the required number of stages is powerful it allows you to find by visual feedback what changes are likely to be required to achieve the desired separation, if it is possible. This technique can be used regardless of whether there are azeotropes and even for relatively ideal systems. This initial analysis provides information and insights for carrying out detailed design calculations with process simulation software.
Raymond E. Rooks is a senior research specialist for the Dow Chemical Co., South Charleston, W.Va. E-mail him at [email protected].
References
1. Doherty, M.F. and M.F. Malone, Conceptual Design of Distillation Systems, McGraw-Hill (2001).
2. Barnicki, S.D., Put your column on the map, Chemical Processing, 67 (9), p. 39 (Sept. 2004).
