Electrical energy once largely was regarded as an inexpensive input for a compressed air system. Questionable design practices could be tolerated as long as production was not affected negatively.
When concerns with the air system did arise, energy costs usually were not considered relevant. Typically, the quickest and least-expensive upfront solution was implemented. If production was happy with the short-term results, the air system once again could be ignored.
Fast forward to today's business environment. Electrical costs no longer can be ignored. Decisions involving capital improvements to an air system have far-reaching cost implications in terms of future energy consumption.
Plant operators no longer can afford the risk associated with a poor decision. Essential considerations for a system enhancement should include:
Achieving energy efficiency.
Conserving capital.
Generating reasonable cost savings today.
Maintaining peak performance, given the uncertainty of the future demands, while focusing on maximizing production output and delivering a quality product.
Foresee savings
Don't have a crystal ball to predict the savings associated with a proposed system change? You might want to consider computer modeling.
Computer modeling can forecast future savings with reasonable accuracy, reducing the risk of a poor decision. Until recently, compressed-air-system modeling primarily involved the use of compressor capacity and power curves to predict energy savings. For static or constant-demand profiles, these simplified curves can yield acceptable results, provided the user understands their assumptions and limitations.
Instead of making comparisons at any particular flow rate, time-dependent or deterministic models evaluate the potential energy savings at all flow rates and with a particular series of demands. It is important to show how the system responds to a series of changing flow demands, not just a particular flow rate. The more dynamic the system, the greater the need to consider time-dependent sequences. The following questions might need to be addressed in a dynamic air system:
Do high flow rates occur for long periods of time or are they just transient events? How do they affect the system?
Are high flow demands transient and short term or of extended duration?
Do differences in production runs cause compressed air flow patterns to change?
Do pressure drop problems require investigation?
Are constraints present that will prevent certain equipment from operating?
Computer modeling requires a series of tradeoffs among accuracy, complexity and desired results. Microsoft Excel or other commercially available spreadsheet software can be used to program a computer model that can be executed quickly.
The key questions in designing a time-dependent model are:
What characteristics or results are to be identified by the model?
What time interval is required to accurately illuminate these characteristics?
What and how much data are required?
What constraints related to data processing or data storage are present?
Each of the questions involves a decision about what time interval (Dt ) the model should use. Selection of a time interval depends on the individual system and how the results will be interpreted.
Systems that are relatively static can use longer duration intervals and provide enough detail for meaningful results. For instance, a hydroelectric reservoir system might need only daily stream inflow averages to determine storage and release levels. A heating, ventilation and air conditioning (HVAC) system might need only 15-minute temperature averages to determine when to switch from unoccupied to occupied status each morning.
These systems can be considered static in that their storage is very large (e.g., a hydroelectric reservoir) or the demands on the system (HVAC) change slowly. Compressed air systems lack either of these characteristics.
Consider a typical system with 2,000 gallons (gal.) of storage and a 1,000-cubic-foot-per-minute (cfm) compressor with an average system demand of 700 cfm. If the compressor experiences a fault and shuts down, the air pressure will drop 10 pounds per square inch gauge (psig) in approximately 16 seconds (sec.). Pressure and flow in an air system can change rapidly and, in many cases, data collection intervals greater than 15 sec. might be too long to provide results with enough clarity.
Modeling in action
A plant compressed air system that was audited for two weeks in October 2002 provides a good example for modeling purposes. Before "what if" scenarios can be modeled, a baseline or snapshot of the existing system is needed ," otherwise it will be difficult to determine actual savings. Alternative #1 is the "null" scenario and represents the existing pressure, power and flow profile of the system.
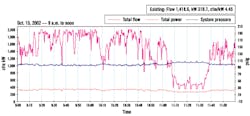
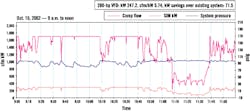
The system block diagram and demand profile for October 15, 2002 (9 a.m. to noon) are shown in Fig. 1 and Fig. 2, respectively. From the graph and interviews with plant personnel, several characteristics of the system become evident:
The plant operates two shifts. The day shift is from 6:30 a.m. to 2:30 p.m. The swing shift is from 3:30 p.m. to midnight.
Lunch and break times are indicated by sustained low flow.
The demand profile is very dynamic.
The system is pressurized 24/7 to maintain air pressure in the fire system.
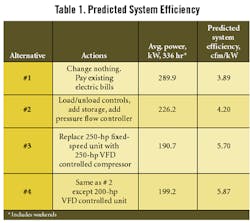
The average flow during the 14-day study period is 1,127 cfm, with an average power requirement of 290 kilowatts (kW), yielding an overall efficiency rating of only 3.89 cfm/kW.
The 3-hour (hr) graph (9 a.m. to noon) using 3-sec. intervals shows the purge demand of a desiccant-type regenerative air dryer. See Fig. 2. The graph indicates purge reduction controls are non-existent or malfunctioning.
The daily average demand is less than the output of the 250-horsepower (hp) (1,269-cfm) air compressor. If an extremely large receiver (more than 1,000,000 gal.) is installed, startup of the second compressor could be prevented. A receiver this large, however, is not practical.
Figure 1. The Starting Point
A system block diagram provides a snapshot of the current compressed air system setup.
An overall efficiency rating of only 3.89 cfm/kW allows room for improvement. In theory, an ideal air system would have an efficiency rating above 6 cfm/kW for all flow rates. This ideal system would have a constant cost per cubic foot of air produced and allow additional savings when demand is reduced.
The goal of computer modeling is to identify scenarios that yield an average system efficiency greater than 5 cfm/kW. How should the system configuration and automation controls be enhanced to increase system efficiency while conserving capital?
Figure 2. Existing System Demand Profile Provides Clues
This 3-hr pressure, power and flow profile of the existing system provides a baseline for the evaluation of "what-if" scenarios.
By proposing alternatives (1 through 4), the model will reveal whether or not the efficiency rating can be raised above the 5 cfm/kW threshold. The chosen alternatives, a narration of the modeling steps and the results are summarized below.
Alternative #1
. Do not change anything and live with current energy costs (Fig. 1 and Fig. 2).Alternative #2.
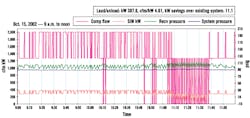
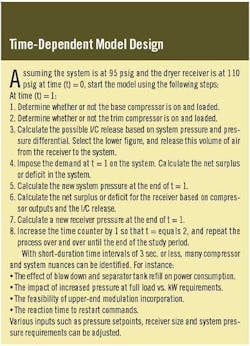
Convert the existing compressors to load/unload control. Add a 3,800-gal. receiver and pressure flow controller. The predicted system performance is shown in Fig. 3. With a simple cascading set of pressure setpoints based on the dry receiver pressure, a time-dependent model can be designed. See the sidebar.Figure 3. Alternative 2: Load/Unload Configuration Reveals Some Savings
The compressors in Alternative #2 operate load and unload as needed to satisfy the pressure signal at the dry receiver. The pressure flow controller maintains downstream air pressure in a narrow band. System efficiency improved from 3.89 cfm/kW to 4.2 cfm/kW.
Alternative #3.
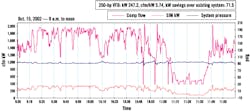
This alternative involves a different capacity-control approach. The existing 250-hp compressor is replaced by a 250-hp variable-frequency-drive (VFD) controlled air compressor. The predicted system performance is shown in Fig. 4.Figure 4. Alternative 3: New 250-Hp VFD Replaces Fixed-Speed Operation
Under Alternative #3, the header pressure varied between +/- 5 psi from the desired pressure, a deviation acceptable to plant personnel. System efficiency rose to 5.7 cfm/kW.
Alternative #4
. In the interest of preserving capital (reducing project costs), this alternative substitutes a 200-hp VFD compressor for the 250-hp unit in Alternative 3. The predicted system performance is shown in Fig. 5.Table 1 provides a comparison of the four alternatives and lists the average power required over the two-week study period. It also indicates the predicted system efficiency if the alternative were in place. Plant personnel believe the 14-day study period is typical and a good representation of the entire year. However, the Alternative #4 pressure profile indicates the proposed system would not be able to meet system demands and that the pressure falls below acceptable limits.
An Excel spreadsheet and the modeling steps previously described can be used construct a detailed model of a compressed air system. System parameters can be manipulated easily and the results computed within seconds. The demand profile also can be adjusted to reflect a leak reduction program or the addition of moisture load/purge controls for the air dryer.
Additional scenarios also can be investigated. What if management would like the ability to expand production during the next three to five years? Could the proposed design meet the higher demands with the same high efficiency?
Pressure profiles
The energy results obtained from the detailed model are similar to results obtained using other methods. However when short-duration time intervals are used, pressure profiles can be plotted to reveal whether or not a particular alternative will maintain header pressure above a minimum level.
Each scenario modeled in the summary table saved energy, but decisions should not be made based on energy savings alone. The 3-hr period beginning at 9 a.m. was chosen because its profile had large swings in demand.
Alternative #2.
As shown in Fig. 3, the compressor(s) operate load and unload as needed to satisfy the pressure signal at the dry receiver. The pressure flow controller maintains downstream air pressure in a narrow band.Alternative #3
. As shown in Fig. 4, the VFD control maintains a narrow pressure band. The pressure does rise to unload and fall to reload the 150-hp fixed speed compressor. The header pressure varied +/- 5 psi from the desired header pressure. Plant personnel agreed that fluctuations within this range would be acceptable.Alternative #4.
As shown in Fig. 5, the system was not able to hold stable pressure levels. The pressure drops below 80 psig for several minutes. Regardless of the energy savings, this alternative should not be considered further unless demands are reduced or a large receiver with a flow controller is added.Figure 5. Alternative 4: New 200-Hp VFD Can't Keep Up
Alternative #4 was not able to hold stable pressure levels and could not be considered unless demands could be reduced or a large receiver with a flow controller could be added.
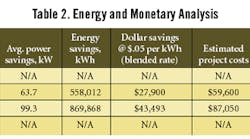
An energy and financial analysis is needed to rank the options further. Many financial benchmarks can be used to evaluate alternatives. For this discussion, simple payback is used. See Table 2.
Table 2 indicates that Alternative #3 has the shortest payback, but Alternative #2 also has a relatively short payback and requires less capital. Further evaluation of project life expectancy, dryer enhancement, possible salvage values, tax credits, future energy costs and future changes in the demand profile also should be considered before making a final decision.
Conclusions
Using commonly available computers and software, plant personnel can calculate compressed air energy savings with a high level of confidence. Energy savings can be predicted using various tools, but more important is the ability to predict how the header pressure responds to dynamic changes in system demands.
1Watson and Scutella, "Slashing Compressed Air System Costs," Chemical Processing, June 2002; van Ormer et al., "Choose a Winning Drive Strategy," Chemical Processing, November 2002.
Yarnall is manager of the Auditing and Consulting Group of Rogers Machinery Co., Portland, Ore. Contact him via e-mail at [email protected].
