Polyethylene manufacturers rely on ethylene producers to supply product that conforms to well-defined specifications. Three impurities are critical from a catalyst point of view: carbon dioxide (CO2), carbon monoxide (CO) and acetylene. The precise and accurate measurement of these three impurities is essential in determining the impact on the catalyst used to manufacture the polyethylene.
The catalyst is a major expense in polyethylene production; waste minimization can translate into substantial cost savings. However, current measurement technology might not detect trace levels of CO and CO2 accurately. CO can tie up eight times the amount of catalyst as ethylene alone. Nearly 50 billion pounds of ethylene is manufactured into polyethylene in North America each year, meaning this can amount to hundreds of millions of dollars in wasted catalyst.
With these high financial stakes, it is critical that the analytical method used to establish the background in ethylene is both accurate and precise. Therefore, the author's company* (the company) and the American Society for Testing and Materials' (ASTM) D2 Committee jointly sponsored a project that involved an extensive evaluation of the popular methanizer flame ionization detector (FID) gas chromatography (GC) method. The goals of this "round robin" project were:
To evaluate GC systems that analyze CO, CO2 and acetylene in an ethylene matrix.
To cover concentration ranges of 5 parts per million (ppm) down to 25 parts per billion (ppb).
To eliminate the impact of standards by providing two high-accuracy primary standards.
The results of this evaluation showed the popular methanizer FID technology had significant bias that could result in an underreporting of the level of CO and CO2; therefore, it could have a significant impact on the cost-efficiency of the polyethylene manufacturing process. These findings were presented at the Gulf Coast Conference last September in Galveston, Texas.
Experiment design
The overall experiment was designed in concurrence with representatives from both the company and the D2 committee. In general, each participant in the study received six different samples and two primary standards.
The company's advanced application group in Geismar, La., prepared both the samples and standards. The materials were prepared under a stringent protocol to ensure material accuracy.
The validity of the samples and standards was tested on two GC systems. Based on previous work, special attention was placed on the GC support gases, using only ultra-high-purity (UHP)-grade materials. Finally, the team applied a consistent and rigorous analytical protocol to material testing.
Analytical systems
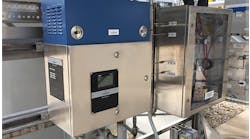
Two analytical systems were used: a methanizer FID GC system and a pulse discharge ionization detector (PDID) GC system. The two systems were built around Agilent instrumentation modified by Wasson ECE. The data generated by these two systems were collected on an Agilent ChemStation system.
A few differences between the two systems were noted. The methanizer FID system was built on a 5890 Series II GC. The instrument used 5.0-grade (99.999 percent purity, or UHP-grade) helium (He) and hydrogen (H2) support gases. Separation of both CO and CO2 was accomplished on one analytical column.
The PDID GC system was built on a 6890 Series system. This system was equipped with a Wasson VPS system to enable sample pressure control, as well as a Valco Inc. PDID. The carrier gas was 6.0-grade (99.9999 percent purity, or UHP grade) He, followed by a high-temperature getter system. Separation of the CO and CO2 was accomplished on two columns.
Support gases
The quality of the support gases used for both carrier and detector makeup gases plays a significant role in measurement accuracy. For the methanizer FID tests, Test One used typical 5.0 grades of He and H2 as support gases. Zero-grade air was used for the FID support. Both He and H2 can have ppb levels of both CO and CO2 as impurities.
In Test Two, both He and H2 were changed to methanizer FID grade. In the case of H2, this grade is derived from a chloro-alkali process. Unlike that produced through other processes, this material is free from both CO and CO2.
In the case of He, the bulk material is purified through a cryosorption process. To further ensure the integrity of the gases, a high-temperature getter was placed in line for the He, and a low-temperature getter was placed in line for the H2.
In the case of the PDID system, a 6.0 grade He was used to prevent this universal detector from biasing both the CO and CO2 measurements. To ensure none of these compounds were present in the He, a high-temperature getter was placed between the cylinder and the GC system.
Preparing standards and mixtures
To ensure the validity of the tests, the researchers were required to control the following variables:
The quality of the ethylene used to make the mixtures.
The integrity of the cylinder in which the mixtures were to be prepared.
The methodology used to ensure the accuracy of the resulting mixtures.
The company acquired some very high-purity ethylene that was known to be low in both CO and CO2. This starting material was assayed to ensure the product claim. The cylinders used to make the test mixtures/standards were prepared to ensure the stability of both the CO and the CO2.
The sample and standard mixtures were prepared using the standard addition method and then analyzed. A more concentrated mixture was used to make the more diluted mixtures. To ensure the reliability of the resulting mixtures, a gravimetric uncertainty of +/-0.2 percent relative was used. Each mixture then was homogenized after the manufacturing process.
Each mixture was prepared based on the assumption that no CO or CO2 was present in the ethylene. The only CO and CO2 came from the blending mixture. The CO and CO2 background in the ethylene could be calculated based on a regression analysis of all the analytical results. The methane, ethane and acetylene concentrations were varied to represent typical systems.
Analytical protocol
To ensure the validity of the background measurements, the researchers followed a well-designed analytical protocol that included:
The performance of a statistically valid number of injections, typically three to four injections per test mixture.
Testing of the instrument with the same test mixture twice per day to monitor the instrument drift.
Calculation of the mean response of several injections from statistically valid injection data.
Relative standard deviation was important to the test results ," the tighter the results, the greater the accuracy of the background measurement on the ethylene. Both detectors were known to be linear in response characteristics. The data were not force-fitted to other equations to maximize the coefficient of variation.
The CO tests
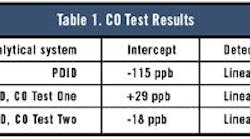
The PDID data were evaluated. The regression analysis showed the data had a 0.9997 correlation coefficient and a non-zero intercept. Because the higher concentration point has a tendency to skew the data, the data were re-evaluated with only the lower part of the curve. However, the data on the lower part of the curve were not as precise as those on the higher part of the curve. The correlation coefficient was only 0.9985 with a zero intercept of -115 ppb.
Evaluating CO data
To test their hypothesis that the ethylene used to make the mixture contained 115 ppb of CO, the researchers increased the concentration of the samples by 115 ppb and re-plotted the data. The curve showed the correlation coefficient did not change, and the zero intercept was 0.06 ppb.
Test One with the methanizer FID system showed a curve with a correlation coefficient similar to the PDID, but the intercept was +29 ppb. This inferred that the system had no response at 29 ppb.
In Test Two with the FID, the correlation coefficient was a little better (0.9996) than both Test One and the PDID, but the intercept was -18 ppb.
That the PDID shows a negative intercept infers the existence of a 115-ppb CO background in the ethylene used to make the test mixtures. In the case of the methanizer FID Test One, the results indicate the signal was suppressed by some 29 ppb. This typically is seen in cases in which the support gases have some level equal to or greater than the sample. In the methanizer FID Test Two, the levels of both CO and CO2 in both He and H2 were reduced to sub-ppb levels. In this case, the system shows the CO background in the ethylene was 18 ppb.
The PDID provided relatively good results all the way down to the 50-ppb level. The methanizer FID still provided more precise measurements over a wider range of concentration ," except for one excursion at 125 ppb. This detector still provided precise information.
Table 1 shows the CO test results.
The CO2 tests
The PDID regression analysis on the bottom part of the curve showed a correlation coefficient of 0.998 and a zero intercept of -178 ppb. Methanizer FID Test One showed a correlation coefficient of 0.9994 with an intercept of -195 ppb.
Test Two showed a correlation coefficient of 0.995 with an intercept of -181 ppb.
Unlike the CO testing, the CO2 tests showed little deviation between the PDID and the methanizer FID. The impact of further purification is not unexpected because the CO2 in the H2 and He is very low, typically in the ~10-ppb range.
The PDID provided more precise measurements for CO2 than for the CO measurements. The precision of both systems, however, is still good enough to enable confidence in the results obtained.
Table 2 shows the CO2 test results.
Overall test results
The PDID data are of high enough quality that the researchers could not ignore the 115-ppb background in the base ethylene used to make the mixtures. The fact that the methanizer FID is susceptible to support-gas bias is troublesome because much of the petrochemical industry uses this detector for making CO/CO2 measurements.
Are other variables associated with the methanizer FID suppressing the CO response? This possibility requires further investigation.
Conclusion
Based on the results of this rigorous testing process, the company presented the following conclusions to the ASTM D2 committee:
The present methods used to measure both CO (methanizer FID) and C2 H2 (FID) at <500 ppb are inadequate.
The use of a common high-accuracy standard significantly improves both the precision and accuracy of the GC methods.
The use of PDID and He free from CO/CO2 eliminates bias.
The use of support gases (He and H2) free from CO/CO2 on a methanizer FID reduces the bias, but does not totally eliminate it.
The agreement between the two methods is excellent when both systems use support gases of the same quality. The CO2 work also validates the quality of the test mixture generated for this study because the minor components were introduced from the same blending mixtures.
Researchers must perform additional work to ascertain the reason for the bias between the two analytical methods. The extensive use of the methanizer FID in both petrochemical applications and the standards manufacturing process could continue to perpetuate the bias in the measurements.
The use of support gases (He and H2) free from both CO and CO2 reduces the bias that is observed on the methanizer FID. High-quality standards at the ppb level can be manufactured effectively in an ethylene matrix. The process of establishing the background in the base ethylene can be biased by the analytical method used.
The manufacture of polyethylene with undetected impurities can have significant adverse financial impacts. Therefore, the use of high-purity methanizer FID support gases is a wise first step for the petrochemical industry in addressing this measurement bias issue. CP
Denyszyn is a manager with Praxair Distribution Inc., Houston., which is part of Praxair Inc., a global supplier of atmospheric, process and specialty gases, high-performance coatings, and related services and technologies. He can be reached at [email protected].


