Online Analytics Improves Batch Operations
The goal of batch manufacturing is to safely produce a maximum yield batch within product quality specifications in the shortest amount of time and with a minimum amount of waste. However, achieving that goal presents many challenges. Operators often work in a highly complex, interlinked and dynamic environment and must manage a large amount of data and information on a running unit. This makes it easy for batches to end up with undesirable processing events or inadequate end-of-batch quality. It also makes it easy for operators and engineers to miss atypical process variation relationships.
The proliferation of data being collected in companies today as well as the expansion of instrumentation and number of measurements are increasing the complexity of the situation. Coupling this with the drive by many companies to do more despite a smaller work force creates a situation where even more things may go unnoticed.
The traditional univariate (one variable at a time) approach to problem solving may provide some insight. However, it can't adequately deal with this complexity because interactions often occur among variables. Unfortunately, the shortcomings of applying univariate approaches are not always realized.
Some companies also determine the quality of a batch by comparing it to a "golden batch," i.e., one that has met quality standards and is considered ideal for a particular process. However, this approach of relating results to a single batch doesn't take into account interactions among inputs and process variables and output quality characteristics. It does not incorporate the concepts of acceptable and unacceptable variation. And, it does not provide any process insight into what is and is not important regarding inputs to the process, the processing conditions, and the effect that this variation has on product quality characteristics. It's a univariate approach to what in reality is a multivariate problem. Trying to replicate the golden batch often just leads to chasing after "fool's gold."
It's better to compare a batch to a multivariate-based model, or a "golden profile," that compiles many acceptable batches and accounts for process relationships and process variability. This allows a much more accurate analysis of that batch and, depending on the techniques used, fault detection and end-of-batch quality prediction. In addition, it affords process insight unobtainable from a golden batch analysis.
However, online analytics that takes into account relationships among variables and also characterizes typical and atypical process and product-quality variation have proven challenging in batch operations for many reasons, including process holdups, access to lab data, feedstock variations, unsteady operations, data organization and concurrent batches. When done however, the benefits achieved usually are immediate and substantial.
To advance these concepts, we have partnered to develop and incorporate online multivariate batch process analytics into the manufacturing process to aid operators and engineers in dealing with this complexity. A six-month field trial started in late 2009 at Lubrizol's plant in Rouen, France; the plant is continuing to use the online batch analytics.
FIELD TRIAL
In preparation for the field trial, Lubrizol formed a multi-discipline team, which included plant operations, to provide inputs.
It was critical that lab as well as truck-shipment data be integrated and available to the analytics package. Feed tank properties needed to be calculated automatically with each new addition of raw materials from truck shipments.
To apply advanced control to a process, its basic equipment must be functioning properly -- otherwise, you risk wasting time and effort in the long run. So, staff surveyed all process instrumentation and loops to ensure that all instruments were problem-free, and loops were tuned to achieve optimum performance.
Before going online with the trial, we ran training sessions so operations personnel were comfortable enough with the new application to use it in the field.
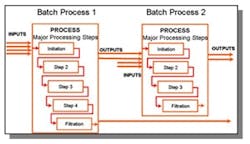
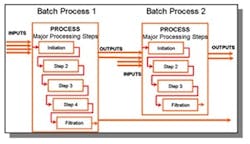
The field trial was run on two batch processes -- each made different products. The output of Process 1 was an input into Process 2 (Figure 1). We used 18 input variables, 38 process variables and 4 output variables for the modeling and online analytics. (Many more process variables could have been included but we deliberately kept the scope small for the trial.) Data were collected at 1-min. intervals. We relied upon historical batches for analysis and model development across these two processes.
We created a separate model for each process stage -- defined uniquely by product, equipment and operation performed. This allowed inputs and outputs used in analysis to differ for each stage.
The tools used for offline development of the models required selection of historical batches as well as appropriate variables from historical data. The tools enabled comparing the results of the model against historical data to determine the model's accuracy or if a particular batch was an outlier and, so, shouldn't be used in developing the model.
Once suitable models were in place, online analytics tools were put to use via a web-based interface. Such an interface was important because some process specialists who would be working with the analytics were located throughout the world.
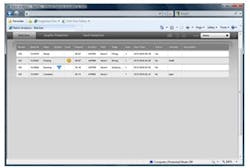
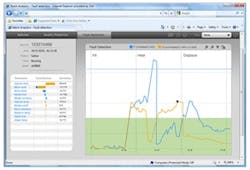
Figure 2 shows the main screen monitored by operators. It displays active batches for each process, along with an indication of any process faults detected. To investigate a detected fault, the operator simply selects the batch and is taken to another display (Figure 3), which provides the statistical charts for the selected batch. Whenever statistical values for the batch exceeded the upper limit (a value of one), the trend for the indicators appears outside of the green zone. The operator can select anywhere on the line to see on the left side of the display the list of contributing variables for this point in time, in order of greatest contribution. To further analyze the situation, the operator can select any one variable to get its individual trend for the selected batch, which is overlaid against the model developed for the particular process, along with the upper and lower limits for the variable (Figure 4). In the example shown, it is clear the variable is trending well above the output from the model and the acceptable variation, so the operator can address the situation as needed.
Finally, the operator can view on a separate trend the predicted end-of-batch quality with confidence limits (Figure 5).
IMPORTANT IMPROVEMENTS
The Rouen facility has realized numerous and ongoing benefits that started immediately. Some include:
• During a "train the trainer" class, the online analytics uncovered a fault in the actual process -- a previously undetected problem with the mass flow meter for a key component charged into the batch. This fault was going unnoticed with "traditional" monitoring systems. This revelation helped highlight the benefits of the technology and certainly got the attention of operations management!
• Once up and running, the field trial showed an increasing deviation on the key-component density measurement through several batches. This phenomenon was linked to the start of plugging. It was quickly solved by applying steam without time cycle impact.
• The online tool indicated a problem with the cooling system of the reactor. It detected that a key component was being introduced too slowly and the reactor temperature was running a little bit higher. The problem was solved on the cooler.
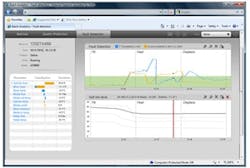

Figure 5. Graph compares process variable trend
to modeled value and limits.
NEXT STEPS
The Rouen field trial was successfully completed in mid-2010. The teams are in the process of updating and redeploying the batch analysis models following several significant process redesign changes. This is necessary because these changes modified the batch operations and phases.
An additional and successful field trial was completed in a bioscience application area. This further cemented the benefits of these approaches to batch process modeling.
If the results of these field trials hold true for others, online analytics will provide manufacturers with additional insight and benefits through greater understanding of batch processes. This should lead to an increase in the consistency of quality products as well as greater throughput through better yields and decreased cycle time and outages -- in short, more good batches at a lower cost to manufacturers.
ROBERT WOJEWODKA is technology manager, process improvement team leader, for The Lubrizol Corp., Wickliffe, Ohio. DAWN MARRUCHELLA is a marketing manager for Emerson Process Management, Austin, Texas. E-mail them at [email protected] and [email protected].
Further Reading
Wojewodka, R., and Marruchella, D., "Benefits Achieved Using Online Analytics in a Batch Manufacturing Facility," WBF Make2Profit Conference, Austin, Texas (May 2010).
Wojewodka, R., and Blevins, T., "Data Analytics in Batch Operations," Control, p. 53, May 2008, www.controlglobal.com/articles/2008/164.html.
Wojewodka, R., Moro, P., and Blevins, T., "Lubrizol, Emerson Redefining Collaboration," online video, www.controlglobal.com/articles/2007/321.html.