0906_design_fig8_resized

Look at Liquid Bypass

May 28, 2009
Such process-side control of tubular exchangers offers advantages.
At many plants the performance of steam-heated shell-and-tube exchangers can significantly impact operations. The three previous articles in this series examined regulation of liquid outlet temperature of tubular exchangers via a control valve on the utility side, either on the steam supply or the condensate return. This concluding article looks at the use of one or two control valves on the process side, specifically, to bypass some liquid around the exchanger.
Figure 1. Low cost option: A single control valve
can provide liquid bypass control.
Click image to enlarge.
Using a liquid bypass addresses two key issues: • Condensate return. Shell pressure is the steam supply pressure, so condensate return isn't a problem. • Fast response. Changing the fraction of liquid that flows through the bypass very rapidly affects liquid outlet temperature. Single ValveFigure 1 shows the simplest arrangement. To reduce costs only one control valve is installed in the liquid bypass line. There're no control valves on either the steam supply or condensate. Condensate flows out of the exchanger through a steam trap. Full steam supply pressure is available for condensate return. The maximum heat transfer rate occurs with the bypass valve completely closed. All liquid flows through the exchanger, providing maximum ΔT for heat transfer and, consequently, maximum heat transfer. The maximum liquid outlet temperature (and associated steam flow) matches that of configurations with the control valve on either steam supply or condensate. However, because the bypass valve is completely closed, there's no way the control system can attempt to exceed maximum heat-transfer capability. There's also no possibility for windup to occur, assuming windup prevention mechanisms are configured in the customary manner. With a control valve only in the bypass it's impossible to reduce the heat transfer rate to zero. The lower limit depends on the size of the bypass piping and the control valve installed in the bypass — a flow simulation can determine the values of these flows, allowing computation of the minimum heat-transfer rate and corresponding liquid outlet temperature.
Figure 2. Operating lines: Equal-percentage valve shows only modest departure from linearity in
both cases. Click image to enlarge
For this configuration the process operating line is a plot of liquid outlet temperature as a function of bypass valve position. This configuration provides an action opposite to that of ones we've previously discussed, namely: Process. Opening the control valve decreases liquid outlet temperature. The process is reverse acting.Controller. If liquid outlet temperature is rising, the controller should increase its output to the bypass valve. The controller must be direct acting. Process operating lines for bypass configurations will have a negative slope; in contrast, those for the control valve on the utility side have a positive slope.
Figure 3. Blocking exchanger flow: This
is the simplest configuration using two
normal control valves.
Click image to enlarge
Results of flow simulations for bypass arrangements depend on the ratio of pressure drop across the exchanger and total pressure drop available for fluid flow. This ratio could be very small (the exchanger takes a tiny fraction of the total pressure drop for fluid flow) or essentially 1.0 (all of the pressure drop for fluid flow occurs across the exchanger). This leads to the following two extremes: Constant total liquid flow (bypass flow plus flow through the exchanger). This occurs when pressure drop across the exchanger is a small portion of total pressure drop available for fluid flow or when a flow controller is installed somewhere in the liquid flow stream. Constant ΔP across the exchanger. In this case, the exchanger is taking all the pressure drop available for fluid flow. Operating lines depend on bypass-valve sizing. Figure 2 presents the lines for a valve sized such that when fully open it provides a flow four times that through the exchanger. While not identical, both operating lines for the equal-percentage valve exhibit only modest departures from linearity — certainly not enough to create problems for controller tuning. When the valve in the bypass line is fully open, liquid flow through the exchanger is at its minimum value. This means the temperature of liquid leaving the exchanger is at its maximum value. Temperature can be computed from flows determined by a simulation. However, it's likely to be very close to the steam supply temperature. This temperature mustn't adversely affect the liquid flowing through the exchanger.
Figure 4. More complex operating lines: All lines contain significant nonlinear
characteristics, making tuning harder. Click image to enlarge.
Usually, except when a liquid flow controller is provided, the real situation is somewhere between these two extremes — that is, pressure drop across the exchanger is a significant part but not all of the pressure drop available for fluid flow. To properly analyze this situation, the simulation must encompass the flow system's remaining parts. Bypass with Two ValvesTo achieve a minimum heat-transfer-rate value of zero requires the capability to completely block the flow through the exchanger. This requires using either two normal control valves, one in the bypass line and one in series with the exchanger, or a single three-way valve. Cost is about the same; using two normal control valves usually is preferable. Several control configurations are possible. Figure 3 illustrates the simplest. One of the control valves is "fail open" while the other is "fail closed." Output from the temperature controller drives both valves. A controller output of 0% passes all flow through the exchanger, providing the maximum liquid outlet temperature. A controller output of 100% bypasses all flow, giving no increase in the liquid temperature. This configuration sometimes is called a "see-saw" arrangement.
Figure 5. Split-range configuration:
When controller output is at mid-range,
both valves are fully open.
Click image to enlarge
For this case the operating lines depend on the sizes of the two valves and on the flow coefficient for the exchanger. Flow simulations are the only way to analyze processes with parallel flow paths and/or two or more valves. The configuration in Figure 3 contains both. As before, there're two extremes, one being for constant ΔP and the other for constant total flow. The operating lines in Figure 4 reflect the same liquid flow when all liquid goes through the bypass (valve on the flow through the exchanger is closed) and all liquid goes through the exchanger (valve on the bypass is closed). All operating lines contain significant nonlinear characteristics that are likely to raise some controller tuning issues. If equal-percentage valves are used, another issue arises. When output of the liquid outlet temperature controller is 50%, both valves are 50% open. But when an equal-percentage valve is 50% open, it only passes around 20% of its maximum flow. So, for constant ΔP, total flow is restricted; for constant total flow, a large ΔP is required across the exchanger.
Table 1: Split-Range Logic
Controller output (%)
Exchanger valve position (%)
Bypass valve position (%)
0
100
0
50
100
100
100
0
100
A split-range configuration is preferable, especially when equal-percentage valves are used (as they usually are). Figure 5 incorporates the split-range logic shown in Table 1. When controller output is at mid-range, both valves are fully open. As controller output increases above mid-range, the bypass valve remains fully open and the exchanger valve closes. As controller output decreases below mid-range, the exchanger valve remains fully open and the bypass valve closes.
Figure 6. Dead zone: Equal-percentage valve likely is preferable despite the flat
region just above mid-range. Click image to enlarge
Figure 6 presents operating lines for the two extremes (constant ΔP and constant total flow). Valve characteristics for temperature controller outputs less than 50% pertain to the bypass valve (the exchanger valve is fully open). Valve characteristics for temperature controller outputs greater than 50% pertain to the exchanger valve (the bypass valve is fully open). Operating lines clearly suggest the exchanger valve should be equal-percentage; the operating line for the linear valve is very nonlinear. Perhaps there's a slight advantage to using linear characteristics in the bypass valve but most likely an equal-percentage valve would be installed. For both cases in Figure 6 the operating line for the equal-percentage valve exhibits a flat region just above mid-range (temperature controller output of 50%). This flat region is more pronounced for the constant ΔP case. Within this region output of the liquid outlet temperature controller barely affects liquid outlet temperature, resulting essentially in a "dead zone" just above mid-range. The general practice today is to implement split-range logic within software (that is, within controls instead of at the control valve). One way to eliminate the dead zone would be to begin closing the bypass valve at a controller output of 40% instead of 50%. Only flow simulations can determine if such changes either reduce or eliminate the flat regions. Flow and Temperature Control
Figure 7. Flow and temperature control: The degree of interaction between temperature and flow
loops depends on the configuration. Click image to enlarge.
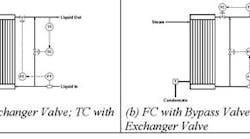
In Figure 7(a) a control valve on the steam supply and a control valve on the liquid return regulate liquid outlet temperature and liquid flow. The liquid valve affects both liquid outlet temperature and liquid flow. The steam control valve affects temperature but has at most a very small effect on liquid flow. With this configuration the temperature and flow loops don't interact. The same is true when the control valve is on the condensate instead of the steam supply. Figure 7(b) illustrates the bypass arrangement. Two control valves are installed, one in the bypass and the other in series with the exchanger. Opening either valve increases the flow. Opening the bypass valve decreases liquid outlet temperature; opening the valve in series with the exchanger raises liquid outlet temperature. This configuration will exhibit at least some degree of interaction. Figure 8 presents the two possible configurations using two simple feedback loops. In Figure 8(a) the exchanger valve regulates flow and the bypass valve controls temperature. In Figure 8(b) the bypass valve regulates flow and the exchanger valve controls temperature. In multivariable control lingo, the "pairing" is said to be reversed.
Figure 8. Liquid bypass configurations: Two control configurations can accommodate two simple
feedback loops. Click image to enlarge.
Loop interaction has two aspects: Steady state. This assesses the degree to which each control valve affects each controlled variable.Dynamics. If one loop is much faster than the other (at least five times faster), the loops are dynamically separated and the degree of steady-state interaction is irrelevant. The dynamic separation for most temperature and flow loops is sufficient for either configuration to function. However, for the exchanger the temperature loop is faster than most temperature loops. Consequently, it's advisable to tune the liquid flow controller to respond as rapidly as possible. From a steady-state interaction perspective, the basis for selecting a configuration can be simply summarized: control liquid flow using the valve with the largest flow. When 70% or more of flow is through the exchanger, the configuration in Figure 8(a) is better. When 70% or more of flow is through the bypass, the configuration in Figure 8(b) is better. But what about the following cases: 1. Flow through the bypass is about 50% of total liquid flow, a point where the degree of steady-state interaction is the greatest.2. Flow through the bypass at times is 70% or more of the total, making the configuration in Figure 8(b) preferable. But, at other times, flow is less than 30% of the total, making the configuration in Figure 8(a) preferable.
Figure 9. Minimizing interactions:
Using summers to determine the
position of each control valve can
reduce the degree of interaction.
Click image to enlarge
Where degree of interaction is degrading loop performance, flexibility of digital controls permits implementing configurations that account for the nature of the process. In Figure 9 a summer determines the position of each control valve. Each summer has two inputs, one from the temperature controller and one from the flow controller. The configuration reflects the following observations: 1. To increase flow without affecting liquid outlet temperature, both control valves must be opened. In Figure 9 the flow controller output is connected to a positive input to both summers. 2. To increase liquid outlet temperature without affecting flow, the exchanger valve must be opened and the bypass valve closed. In Figure 9 the temperature controller output is connected to a positive input for the summer associated with the exchanger valve but to a negative input for the summer associated with the bypass valve.Coefficients on the inputs to the summers in Figure 9 aren't necessarily 1.0, permitting some tuning. But even so, it's unlikely that the configuration can completely eliminate interaction between the two loops. However, it only needs to reduce the degree of interaction to the point where both loops can be tuned to deliver good performance. Cecil L. Smith is president of Cecil L. Smith, Inc., Baton Rouge, La. E-mail him at [email protected]. He is the author of "Practical Process Control," just published by John Wiley.

Sponsored Recommendations

Heat Recovery: Turning Air Compressors into an Energy Source

More than just providing plant air, they're also a useful source of heat, energy savings, and sustainable operations.

Controls for Industrial Compressed Air Systems

Master controllers leverage the advantages of each type of compressor control and take air system operations and efficiency to new heights.

Discover Your Savings Potential with the Kaeser Toolbox

Discover your compressed air station savings potential today with our toolbox full of calculators that will help you determine how you can optimize your system!

The Art of Dryer Sizing

Read how to size compressed air dryers with these tips and simple calculations and correction factors from air system specialists.