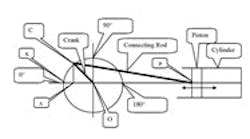
Piston-type pumps, compressors and engines usually are driven by a crank and connecting rod. During the stroke, flow rates don't follow the sinusoidal curve that textbooks and manufacturers' literature often cite. Peak rates are up to 10% higher than predicted by a sinusoidal curve and don't occur at 90° crank rotation. These higher rates increase values of net positive suction head required (NPSHR) by as much as 20% and cause greater stresses and possibly added maintenance. The actual curve is a distorted bell curve controlled by the length ratio of the stroke and connecting rod. Rods shorter than the stroke but longer than the connecting rod need special crossheads to avoid metal interference but create amazing distortion. Knowing the length ratio of a pump and its relation to flow rate provides insights on dynamic and hydraulic features that affect performance. In reciprocating pumps, compressors, etc., the crankshaft and crank move a connecting rod and piston in a cylinder (Figure 1). The crankshaft center is placed at 90° on the 0°–180° x axis; the crank's rod bearing is shown at 45°. Clockwise rotation of the shaft will cause the crank bearing to generate a sinusoidal x-y curve between 0° and 360°. Figure 2 shows this sinusoidal velocity curve between 0° and 180°. It also shows the actual velocity curve for a piston when the rod length divided by crank length is 2.1. It is not sinusoidal. Flow recorders could provide a pump flow profile but it's much easier to use simple trigonometry to calculate piston positions versus crank angles, then calculate piston travel per degree of crank rotation and plot the results. They are not sinusoidal. (Compressors and piston engines would follow similar curves.)
Crankshaft and Crank
Figure 1. This basic design is used for piston pumps, compressors and engines.I've observed the following:
- As already mentioned, peak flow rates are up to 10% higher than a sinusoidal curve predicts.
- The curve shape depends on the ratio of rod length to crank length.
- Peak rate doesn't occur at the 90° point but rather at 95°–120° depending on the ratio.
- From 180° to 360° (the suction portion), the curve is a mirror image of the 0° to 180° discharge portion.
- During the suction portion of the curve, flow rates also are higher and peak earlier than the 270° point.
- The curve also will change if the centerline of the cylinder doesn't pass through the center of the crankshaft.
- Multi-piston pumps and compressors provide less "smoothing" effect than predicted because the bell-shaped curve has a sharper peak.
Piston Velocity versus Crank Angle
Figure 2. Actual curve peaks at a different location and has higher peak.THE IMPLICATIONSThe difference between actual and sinusoidal curves affects many facets of operation and mechanical design:
- Check valves and passages will have higher-than-predicted peak flow rates, and pressure drop will be higher -- by the square of flow rate (20%).
- This will impact NPSHR and possibly induce vaporization as the column of liquid in the suction pipeline is accelerated through valves, etc.
- Even a small amount of vaporization or release of dissolved gas will reduce pump discharge rates substantially. Because flow meters in pulsation flow aren't practical, difficulties often first appear downstream as corrosion or chemical problems. Plant engineers with any indication of such problems should check the many NPSH factors such as air pockets in the pump, supply tank level error, plugs in valves or piping and check-valve backflow.
- Maximum rotation per minute (rpm) will be lower than indicated by the sinusoidal curve. If a pump is running near the manufacturer's maximum recommended speed, starved suction is a possibility.
- Crank length = OC; piston rod length = CP.
- Assume an angle a = SOC.
- Line AC = OC × sin a.
- Line SA = OC – OC × cos a.
- Line AP = (CP2 – AC2)0.5.
- Line SP = AP + SA (piston travel from 0°).
- To find flow rate at any crank angle:
- Loads on bearings will rise somewhat, especially in high-speed compressors.
- Stresses in connecting rods will increase but rod failure is rare.
- Manufacturers of pulsation dampeners and surge suppressors use the sinusoidal curves in their literature and possibly sizing formulas. Yet, surge dampeners must handle the sharper peak of a bell curve compared to a sinusoidal curve. While these devices can't provide constant or pulse-less flow, they do make a major contribution unless terribly undersized, improperly installed or the gas cushion is lost.
Calculate Actual Flow Rates
Refer to Figure 1.(A spread sheet will aid calculations.)b. The difference in piston positions equals piston displacement over the time interval between the two crank angles. It is an average over the two readings, not an instantaneous rate. As the step size approaches zero, displacement nears true velocity.
c. This can be converted into flow rates of in3/min, gpm or other units, if piston diameter and rpm are known.
ASSESS ASSUMPTIONS
The above comparisons should help you understand the real flow environment and thus avoid NPSH and pipe-sizing errors. Calculating stresses due to velocity and acceleration, possibly with simple algebra (see sidebar), can aid in optimizing design of pumps, compressors and engines.
It's all too easy, even in engineering, to accept what appears to be logical. Unfortunately, incomplete or inaccurate analysis leads to less-than-optimum results in many different fields. Another common failing is inappropriately extrapolating data -- see, for instance, "Show Some Skepticism."
ARTHUR H. KRUGLER, P.E., is president of Krugler Engineering Group, Inc., Whittier, Calif. E-mail him at [email protected].


